Today’s update will be brief as we will let the market do the talking at this 6770 inflection point.
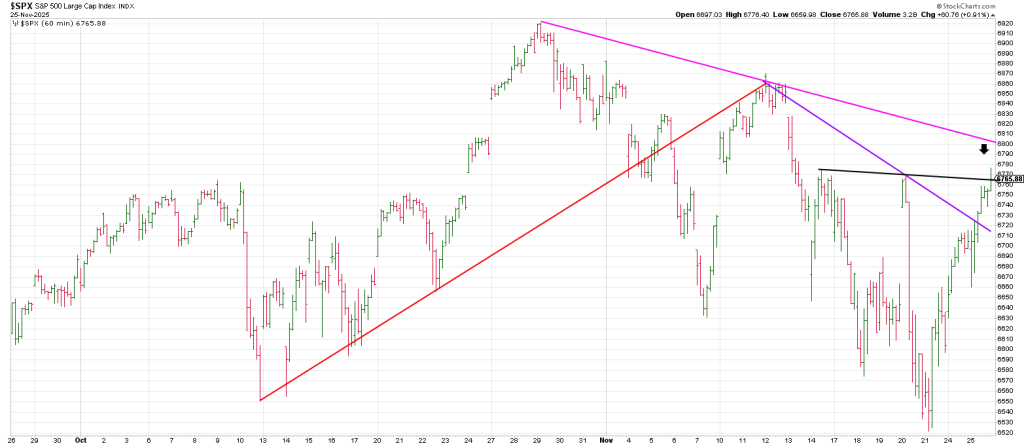
An hourly SPX shows a potential breakout (black Tops Line) but then there is the 6800 magenta Tops Line taken from the all-time high.
Are trend lines important? Does the market adhere to them?
Well from the red Ghost Line, the SPX waterfalled from a Nov 12 pivot.
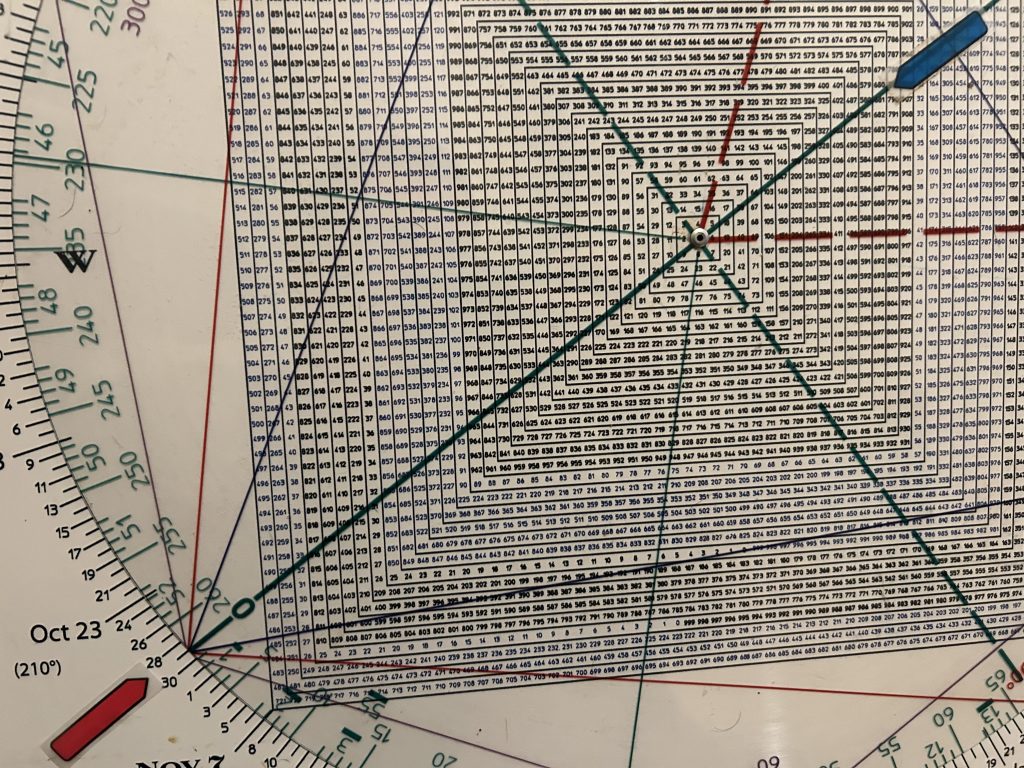
What’s interesting about the potential for a Spike and Reversal to the 6800 region is that 680 is 180 degrees straight across and opposite Oct 29, the so-far high a month ago now.
A 10 min SPX shows a red and blue micro channels.
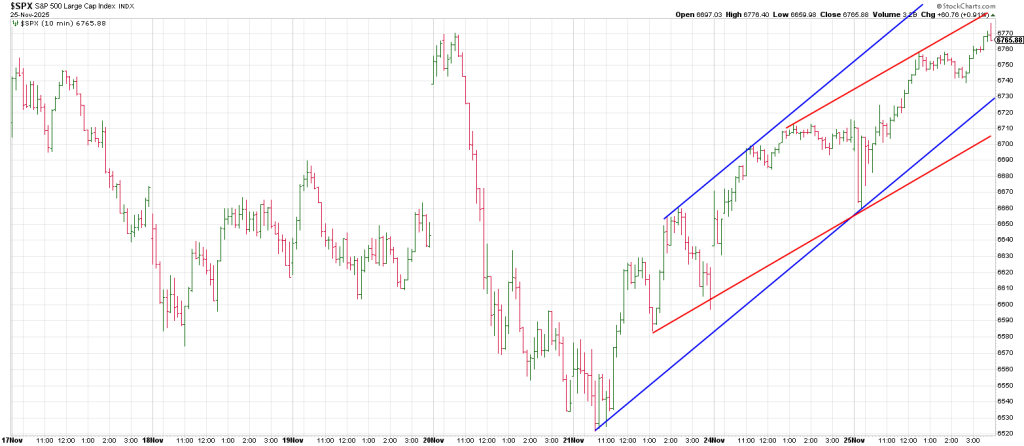
The top of the red channel will be hit again on today’s open.
The top of the blue channel shows potential for higher
On the downside clear-cut support is 6730 to 6700.
Impulsive (5 wave) breakage of those two pivots produces two micro Rule of 4 sell signals.
Pulling back the lens to show the action for 2025 we see key support at 6300.
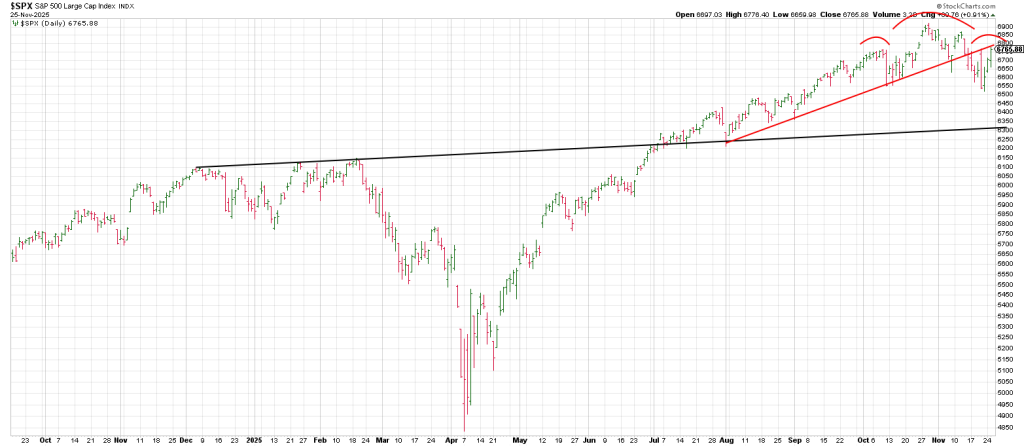
This is a Ghost Line (black) connecting the highs from a year ago and the July/August lows.
Currently the SPX is backtesting broken support (red) which looks like a Right Shoulder.
A rollover from this area points to 6300.