“There is no sense in pretending
Your eyes give you away
Something inside of you is feeling like I do
We said all there is to say.” Breakdown, Tom Petty
“Things that have never happened before are bound to occur with some regularity. You must always be prepared for the unexpected, including sudden, sharp downward swings in markets and the economy. Whatever adverse scenario you can contemplate, reality can be far worse.” Seth Klarman
“The very best money is made at the market turns.” Paul Tudor Jones
Any of you that follow me know that I strive to predict the market.
I know—it’s a mug’s game Everyone tells me to follow the trend and that’s true but in my experience, as a swing trader and day trader, I find that the most money is made at The Turn.
On various time frames….short, intermediate and long term.
I had scant success doing so early in my over 40 year trading career.
I used indicators but found that most all indicators are descriptive rather than predictive.
I turned to Time and Price alone since all indicators are derived from time and price (and sometimes volume)….why not go to the horse’s mouth.
It was the pattern recognition born from the intersection of Time and Price that allowed me to make significant strides.
But my real breakthrough came with another kind of Time/Price analysis—the integration of Time and Price or what W.D. Gann called square-outs.
“When time and price square-out (balance out) expect a change in trend.” W D Gann.
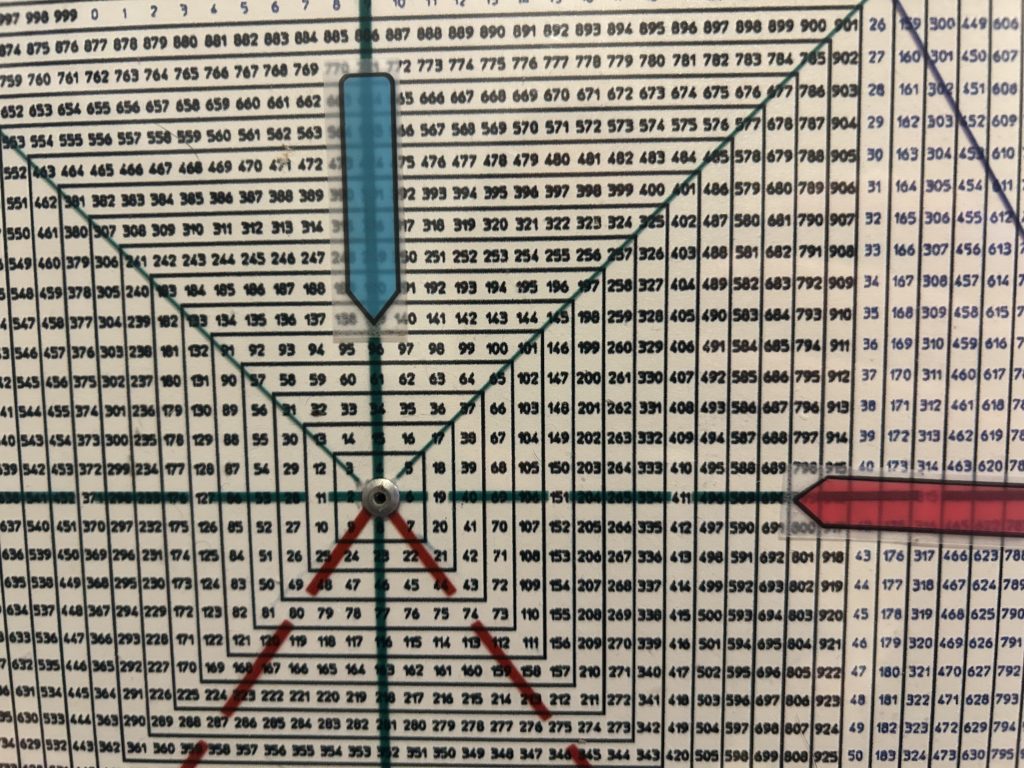
A new world of trading opened up to me when I discovered the Square of 9 Time/Price Calculator.

Square of 9 Wheel
Purchase your own Square of 9 Wheel. Shipping to US only. Contact Jeff for shipping outside the US.
Some of the major turning points it allowed me to call:
1) The March 2000 top
2) The early Sept 2000 Secondary High.
3) The October 2002 bear low
4) The October 2007 bull high
5) The May 2008 pre-crash high.
6) The March 2009 bottom
7) The Jan/Feb 2020 pre-Covid Crash top.
8) The January 2022 high.
9) The October 2022 low.
The Sq of 9 Wheel was the key factor in making these forecasts.
Throughout 2025 I have suggested we may see an harmonic relationship or mirror image fold-back to 1929.
Indeed the SPX topped on October 29, 2025—so far—the day of the Great ’29 Crash.
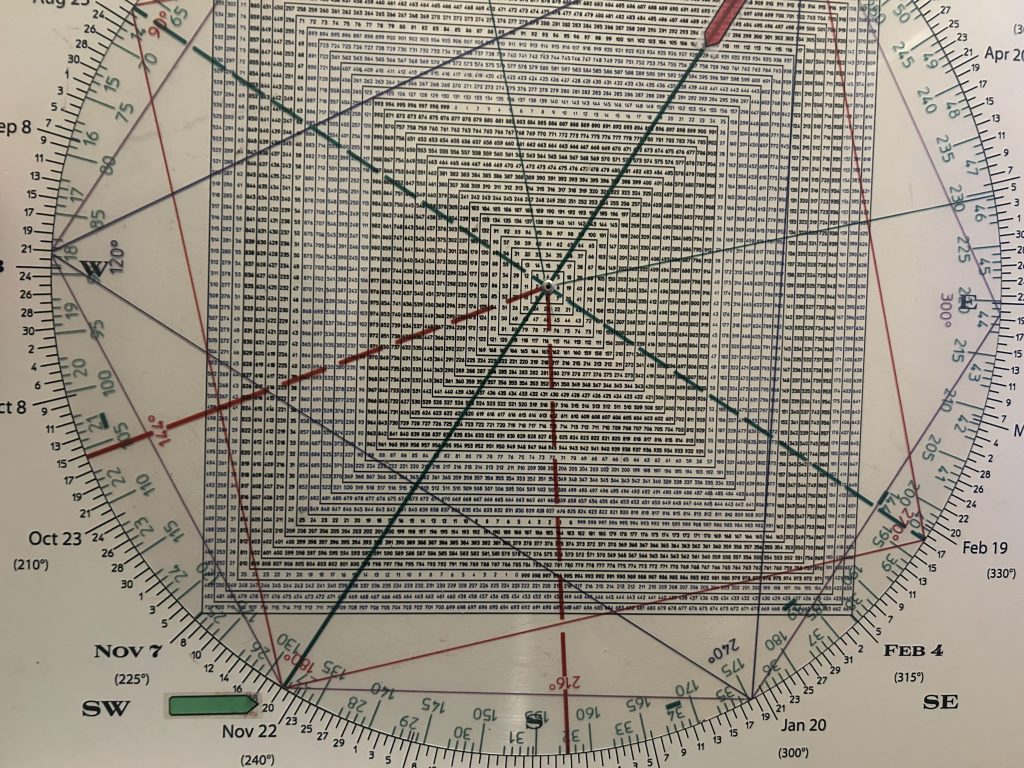
Further,1929 was 96 years ago.
On the Square of 9 the number 96 squares 690.
The SPY all-time high was 690 on Oct 29, 2025.
WD Gann went to Egypt and India to study the Square of 9 where it had been used for thousands of years.
Obviously they were not trading stocks with it.
Likely they were using it as a kind of astrological tool.
This is what prompted me to use the numbers on the number grid as years versus price.
Doing so shows that the year 1929 is 180 degrees straight across and opposite November 20.
Was yesterday the start of a waterfall decline?
Why should Nov 20 this year be critical versus other November 20’ s?
Because the SPX topped on the anniversary of the Big Kahuna in ’29 and because
96 squares our high price that day.
This is how you predict price: synchronicity.
WD Gann stated that all major highs and lows are related harmonically.
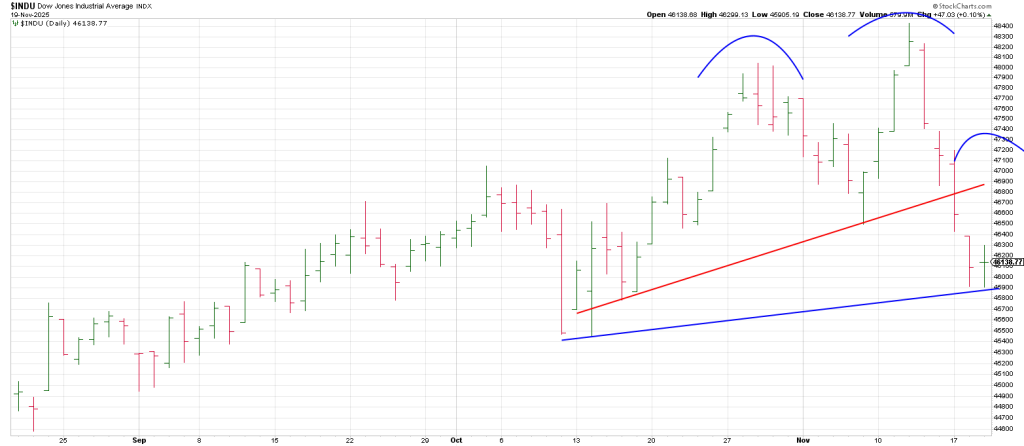
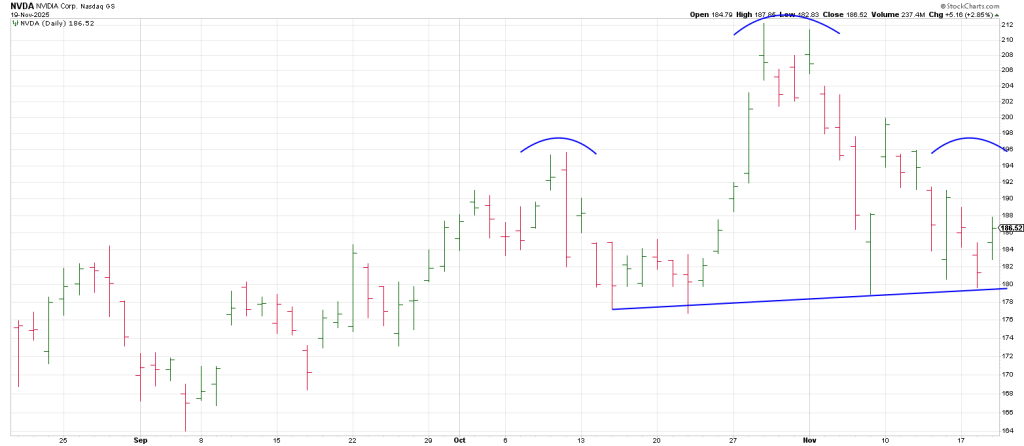
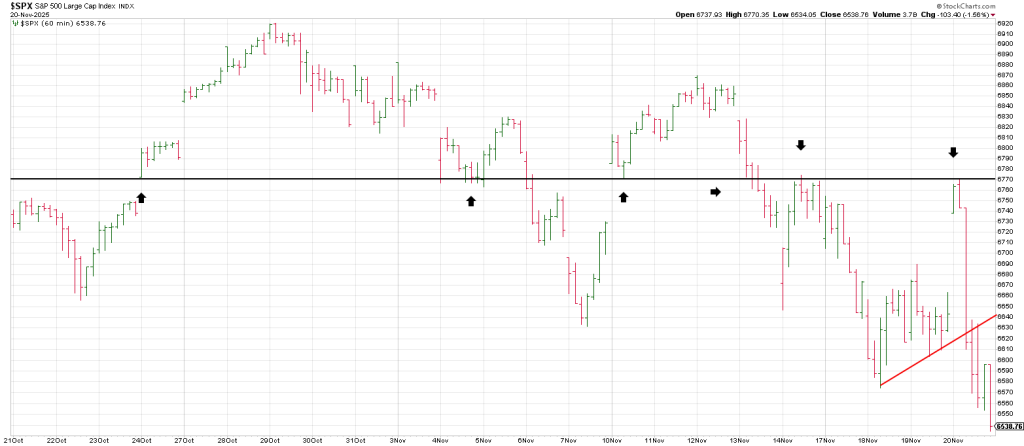
Consequently, with the market ramping Wednesday night following NVDA’s print, we showed the following four charts of the SPX, QQQ, DJIA and NVDA—all showing they each may be spiking to install Right Shoulders.
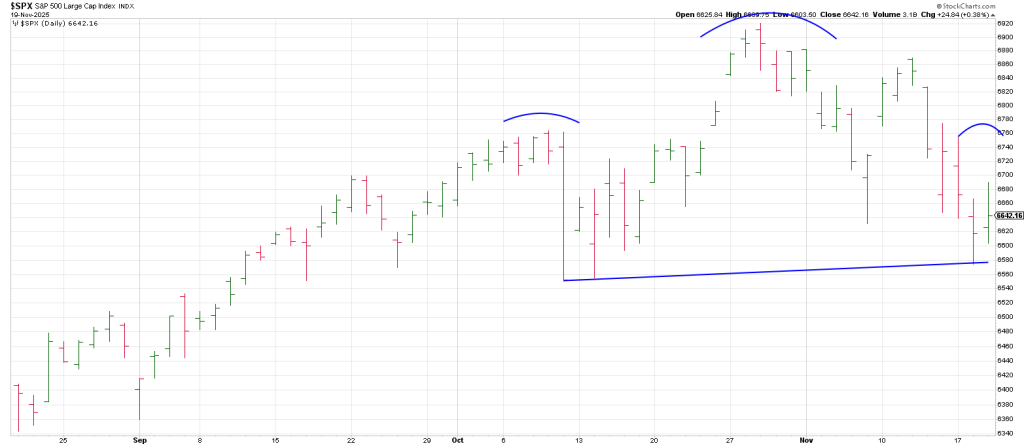
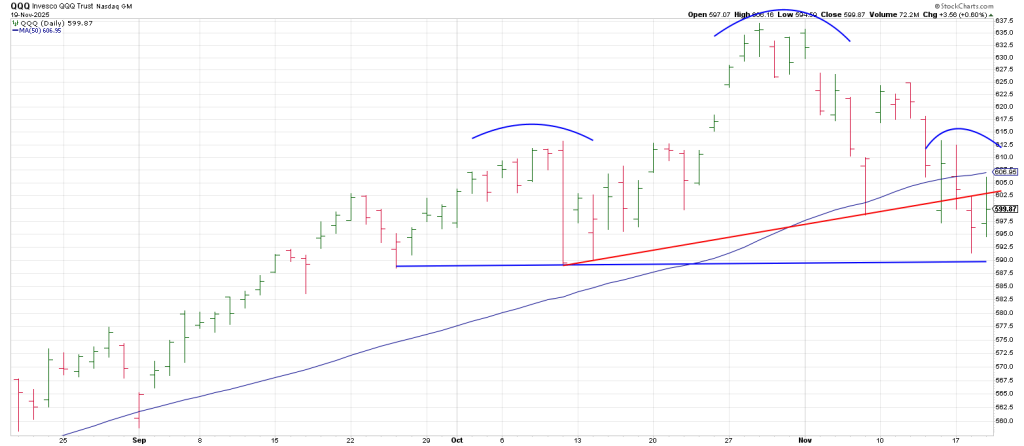
Here’s an updated QQQ.
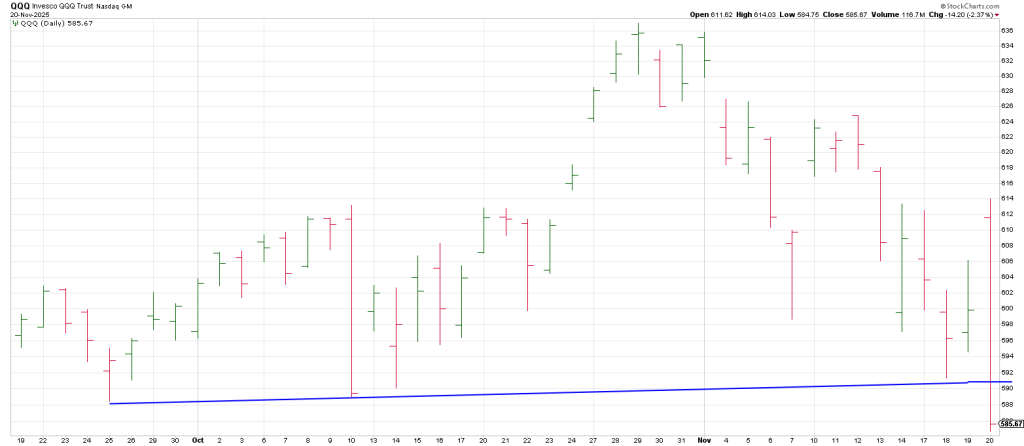
Bearishly the Q’s turned their 3 Week Chart down for the first time since April and accelerated.
Yesterday was the most dramatic Large Range Outside Down Day (LROD or Lightning Rod) I can remember—
Especially following such a strong surge on the open.
It underpins the idea that a powerful 3rd Wave decline has kicked off.
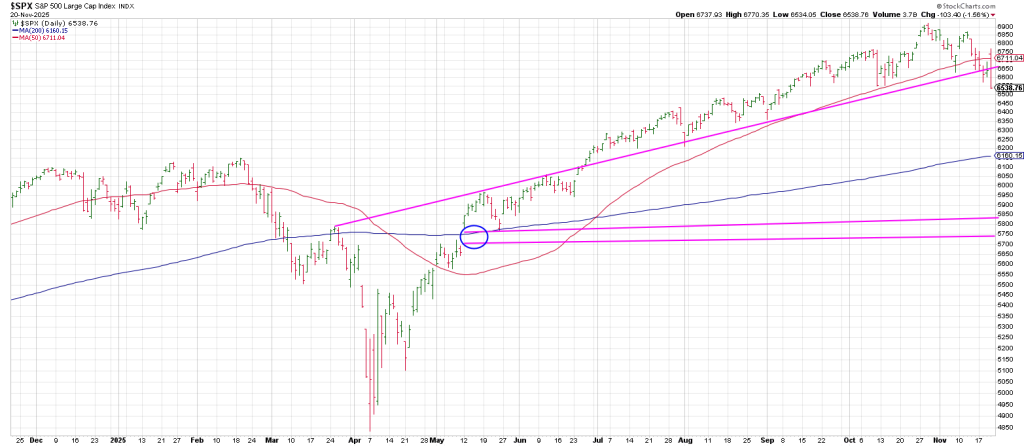
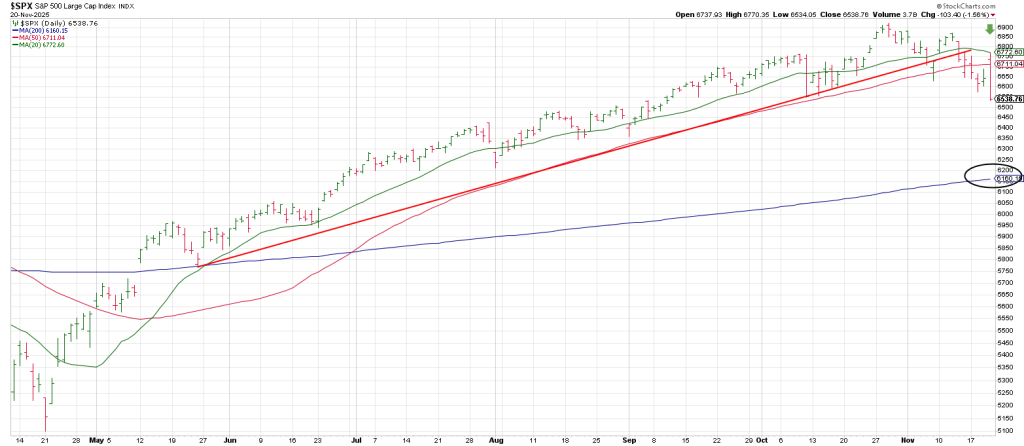
The strong likelihood is the SPX and QQQ test their 200 DMA’s which is the Head and Shoulder projection.
On the SPX from 6920 peak to the 6550 Neckline is 400 points.
400 points off the Neckline is 6150.
The SPX 200 DMA resides at 6160.
Time/Price and Pattern….not funnymentals.
In sum the trinity of Time/Price and then Pattern (potential Right Shoulder) warned against jumping into Thursday’s celebration.
As well so did an unprecedented cluster of Hindenburg Omen and Titanic Syndrome warnings that exposed the background conditions prerequisite to major market slide.
The market warns, but it tempts traders to walk on thin ice by continuing to defy the laws of physics just long enough to get you out to where the Ice Man Cometh.
Naturally I had no idea we’d get such a powerful whiplash.
What I did know was to look at opportunities where stocks were spiking into resistance as good risk/reward shorts.
Names Hit and Run listed as short setups on spikes to specific levels included:
SANM, BE and MOD.
Thursday morning’s report showed the following 10 min chart warning off a potential 1-2/ 1-2 sell setup at the well-defined 6740 resistance.
The chart states: “Failure to rally over 6780 followed by breakown below 6610 is the short term bear case.
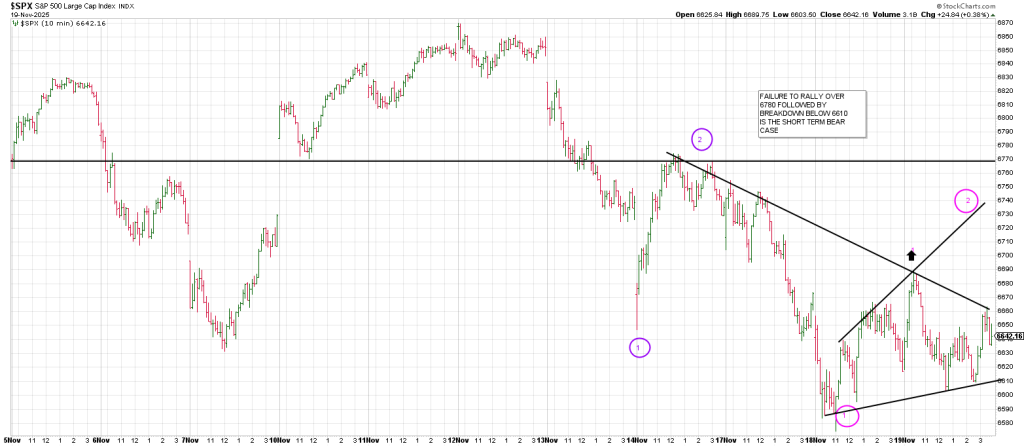
The Great Whiplash started from a first hour spike high at 6770 (literally just below our aforesaid 6780 upside pivot) kissing the 20 day moving average goodbye for a Holy Grail sell set up.
Drilling down to a 10 min we show where are technical dominos fall indicating a major breakdown.
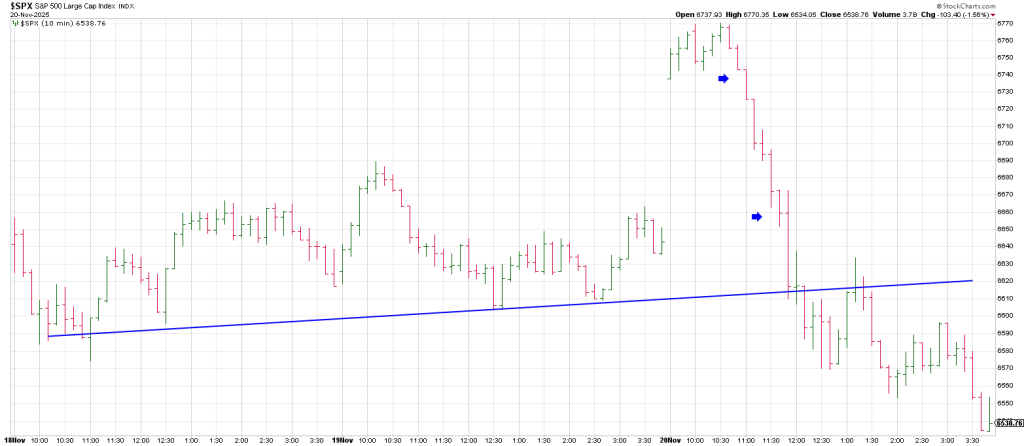
1) An Opening Range Breakdown
2) A more than 50% retrace of the opening surge implies a complete reversal…or more.
3) A continuation Jump the Creek sell triggered upon offsetting the opening up-gap.
4) A Rule of 4 Sell signal is triggered on breakage below a 3 point trend line.
In sum, two of the greatest crashes in history each started on Thursday and collapsed into the following Tuesday.
These were 1929 and 1987.
No one can really point to any negative news catalyst that triggered Thursday’s reversal.
And that’s the point—the news breaks with the cycles not the other way around.
Perhaps the most bearish thing about Thursday’s reversal is that there was no specific story to attribute the selling to.
This just makes players more concerned.
The unknown is always more scary than the known.
The SPX reversed a stunning 234 points finally dropping below the key Oct 10 low and confirming the Oct 29 top.
The SPX settled on its 20 week moving average that had not been seen since May, 180 day/degrees ago.
As well the monthlies turned down for the first time since the advance started.
360 degrees down from the ATH is 6590 which is why this region was so hard to break.
6428 is a cube-out 540 degrees down from high.
6269 is 720 degrees down from high.
A key 1080 degrees down from high is 5856 which ties precisely to 50% of the range at 5877.
It is likely the SPX satisfies a 50% retrace as it has not had a real correction since April.
Caution is warranted.