“Well I won’t back down
No I won’t back down
You could stand me up at the gate of Hell
But I won’t back down.” I Won’t Back Down, Tom Petty and the Heartbreakers
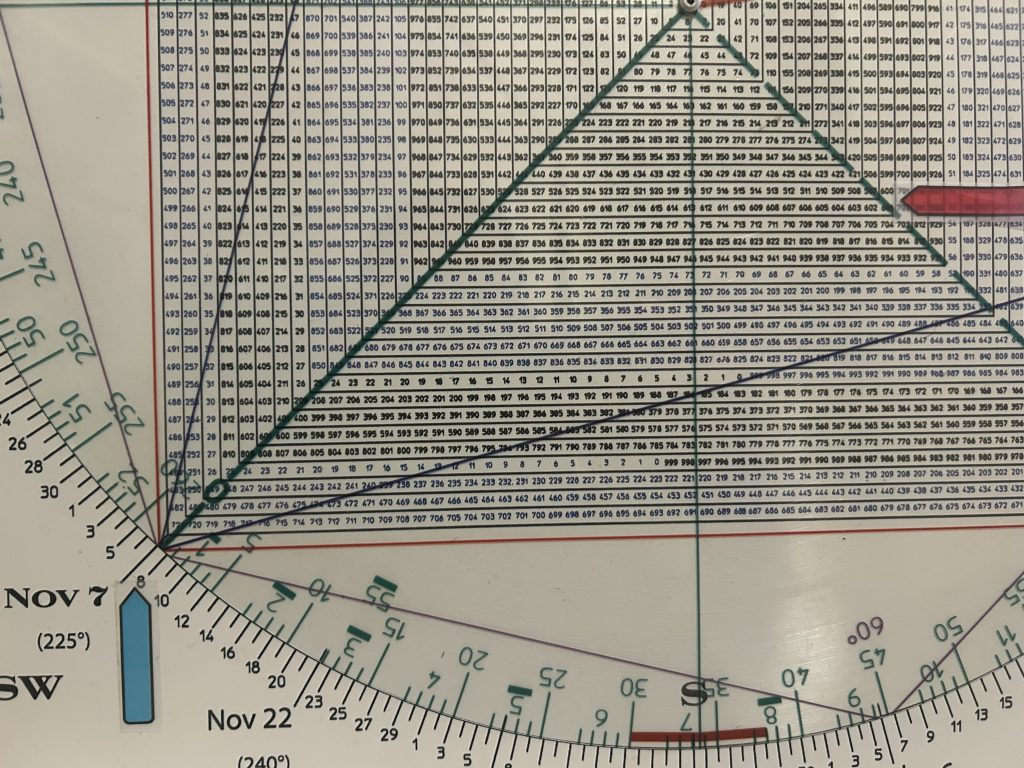
“We use the square o odd and even numbers to get not only the proof of market movements, but the cause.” W.D. Gann
W.D. Gann’s quote above implies that the Square of 9 is more than a simple charting tool; it is a tool for understanding the CAUSE of market movements, not just a tool to predict them.
In my updates since early September I laid out the significance of November 7th.
November 7 squares the year 2025 on the Square of 9 Wheel.
It squares the year 1982 where this great bull market started 43 years ago.
November 7 also squares 43.
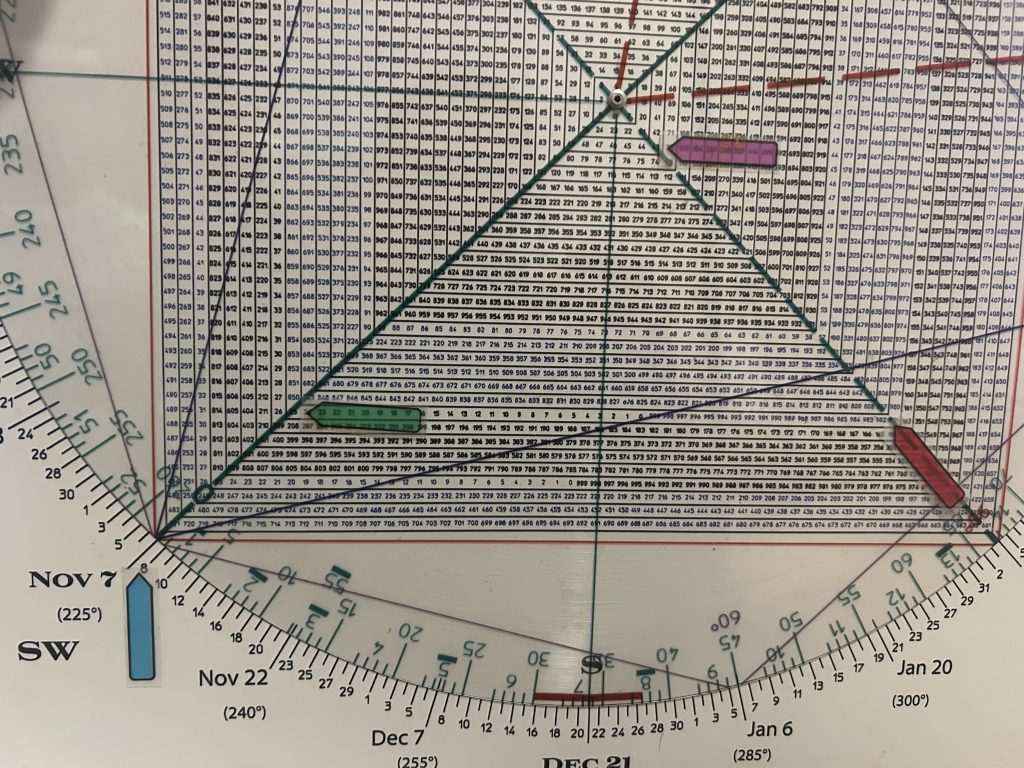
Like a trend line, the more hits you have underpins the significance of time-frame.
Then, Thursday, with the Q’s trading at 615 region on we saw that Friday November 7 squares 660.

The title of Friday morning’s update was “Can the Q’s Drop To 600 Today”
There was a well-defined trend line on the QQQ at the 610 region.
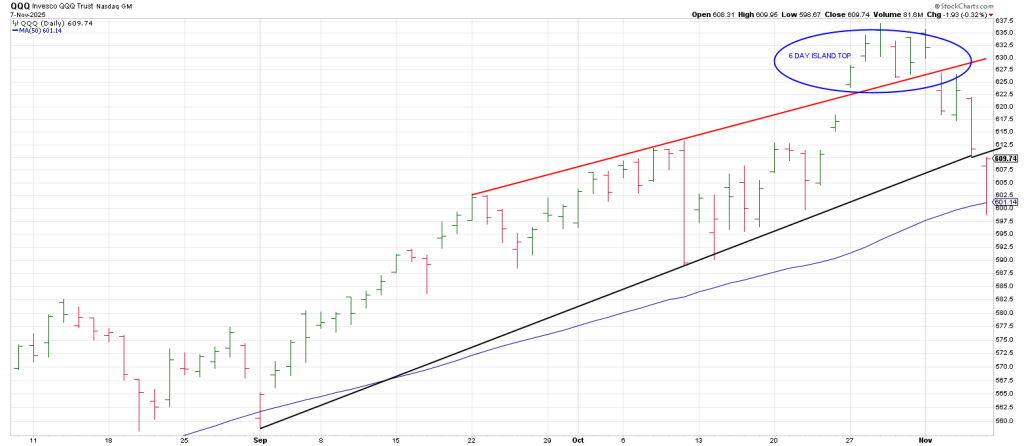
My conclusion was that 610 would be broken on OpEx Friday magnetizing the Q’s to 600.
As is typically the case when these square-out setups play out the item undercuts the square-out tickling the strike.
The trend line at 610 was snapped early Friday and the Q’s water-falled to 598.67.
The 600 Time/Price square-out for Nov 7 proved so powerful that it perpetuated a Bungee all the way back to the 610 strike by the bell.
The Hand saved the QQQ baby at the 50 DMA.
Thursday/Friday’s deep dive satisfied a scenario I laid out when the Q’s left a Breakaway Gap on November 4 producing a 6 Day Island Top.
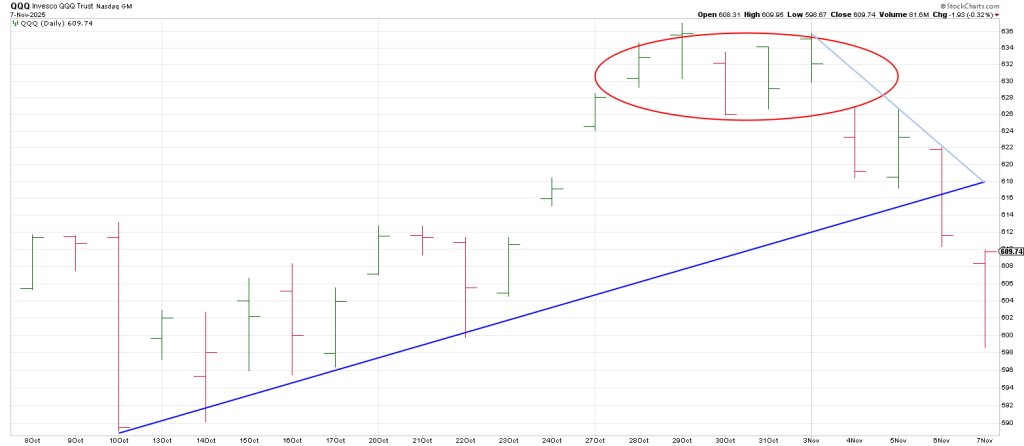
A 10 min QQQ how a Late Day Opening Range Breakout.
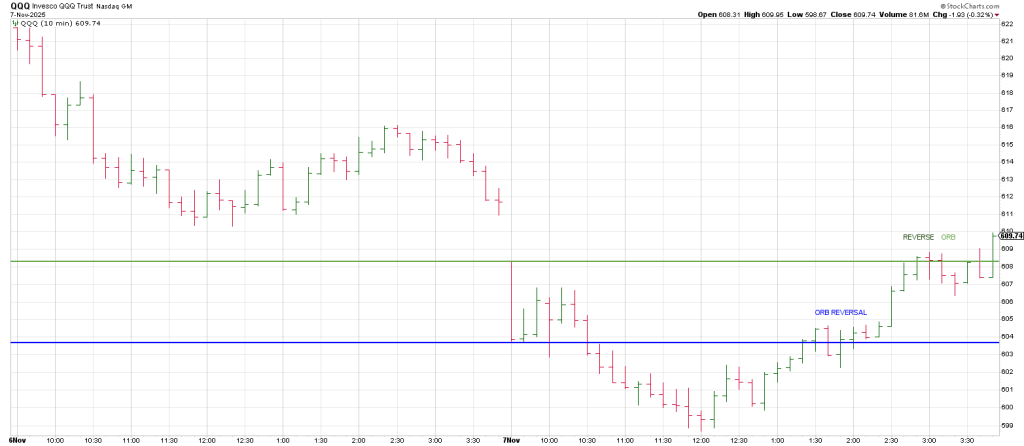
It was a textbook Ketchup Reversal—slow at first, then all at once.
An OpEx Pinball play for the ages.
The aforesaid daily trend line at 610 was flushed creating a vacuum for a Bungee.
An hourly QQQ telegraphed the move with an outside up hourly bar off the low.
When the 3 Hour Chart turned up an extended in league with capturing 50% of the day’s range, it telegraphed a complete reversal of the drop.
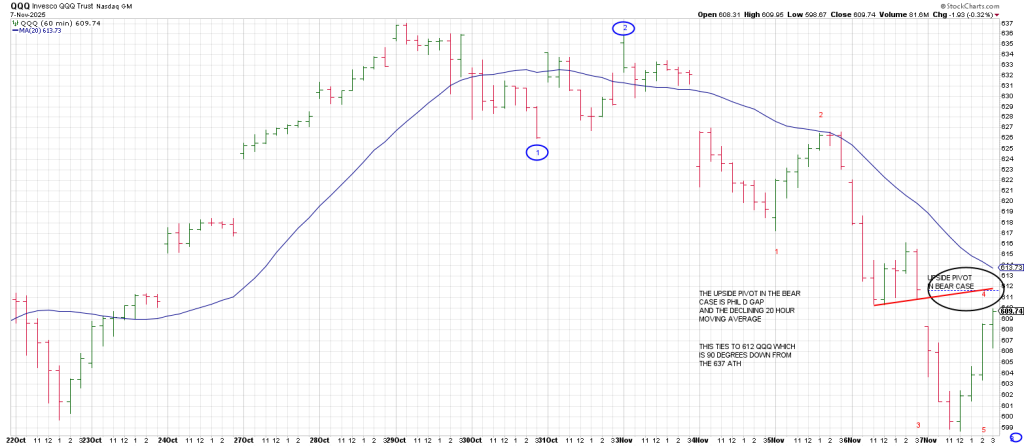
My expectation is that as long as the QQQ remains below the Breakaway Gap (623 region) that this rebound is a countertrend rally, a Wave 2, when it fails a broad-based powerful Wave 3 decline will unfold,
Alternatively if the 20 DMA is reclaimed at, 615 currently followed by the 623 Breakaway Gap region.
A last ditch rally to new highs may play out.
On the SPX the potential in this scenario is 7030 or 718o, as walked through in this space recently.
The 3 Day Chart in the Q’s turned down Thursday.
Today we are set to get one higher daily high.
A second consecutive higher daily high put the Q’s in the Minus One/Plus Two sell position.
The behavior of the market at that juncture will be key to gauge whether a top is already in.
In sum the message of the chart is that the initial leg of a larger impulse move lower ended Friday and a countertrend rally I in progress.
If this is correct the next leg down should see 540 QQQ which is a 360 degree decline from the 637 high.
180 degrees down ties to 599 which Friday’s 598.67 satisfied essentially.
We have mapped out the idealized time frame for a drop to 540 on the Hit and Run Private Twitter Feed this morning.
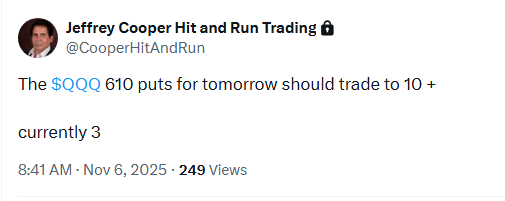
If you were ever tempted to try out this trading service, now is the time to do so.
Going into end of the year our trading holds the potential for major gains.
This includes Bitcoin and the precious metals and miners.
Fifth Hindenburg Omen’s and fifth Titanic Syndrome signals into our November cycles warrant caution…whether there is a Last Ditch Run for new highs or not.
The time and price synchronicities flagged in this space for the last few months suggest the downdraft off the October 29th high is a shot over the bow of the USS Bull.
For its part the SPX turned its 3 Day Chart down right off the high and bearishly continued lower.
That 3 Day Chart low is the upside pivot at 6814 from October 31.
As long as the SPX remains below that the downside door is open.
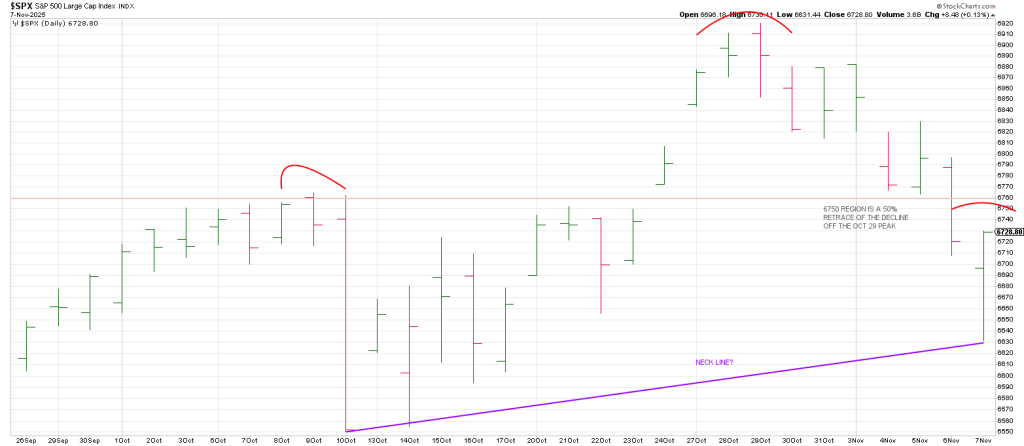
The 6750 region represents a 50% retrace of the decline off the Oct 29 peak.
It may also define a Right Shoulder if that turns out to act as resistance.
As offered above once the QQQ and SPX reclaimed 50% of Friday’s range the door was open to flip the switch into the green.
Hit and Run focused on three names to play the intraday reversal:
PLTR, NBIS and MRVL.
A daily PLTR shows PLTR knifed below it 50 DMA which had acted as good support.
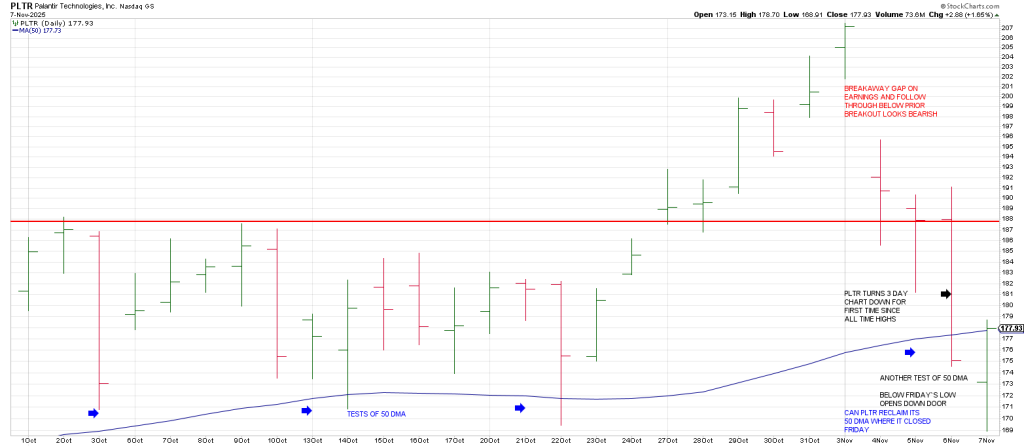
The upside pivot is 188.
PLTR rallied Friday from 169.
169 aligns with November 7 on the Square of 9 Wheel.
Amazing.
Hit and Run took NBIS long in the 106 region. It closed after hours at 114.
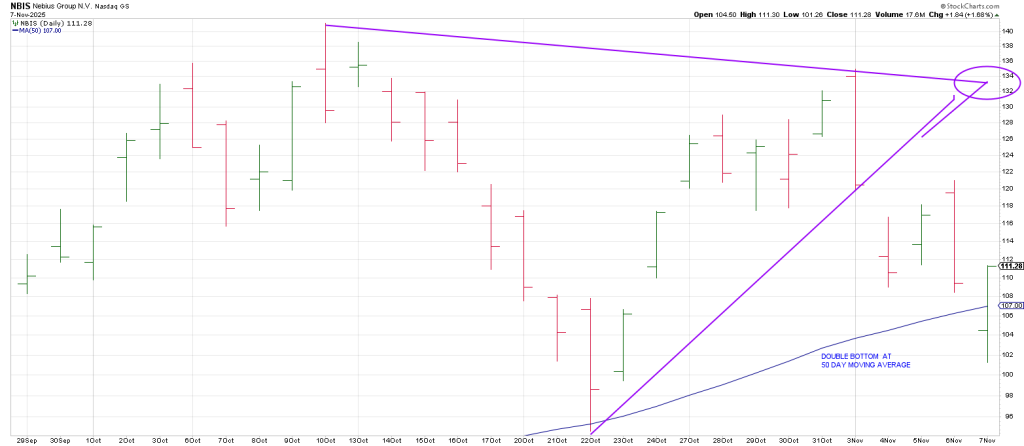
NBIS bottomed at 101 on November 7.
101 is 180 degrees straight across and opposite Nov 7.
Amazing. Certain things in markets are pre-determined.
That means with a Time/Price Calculator (The Sq of 9) you can be in a position to capitalize stunningly.
Notice the undercut of the 50 DMA following a Breakaway Gap below a well defined trend line.
I would not rule out a push to 132 should NBIS offset Thursday’s large range outside down day (LROD or Lightning Rod) at 121.
A 10 min NBIS shows the micro Cup and Handle long setup that triggered our long.
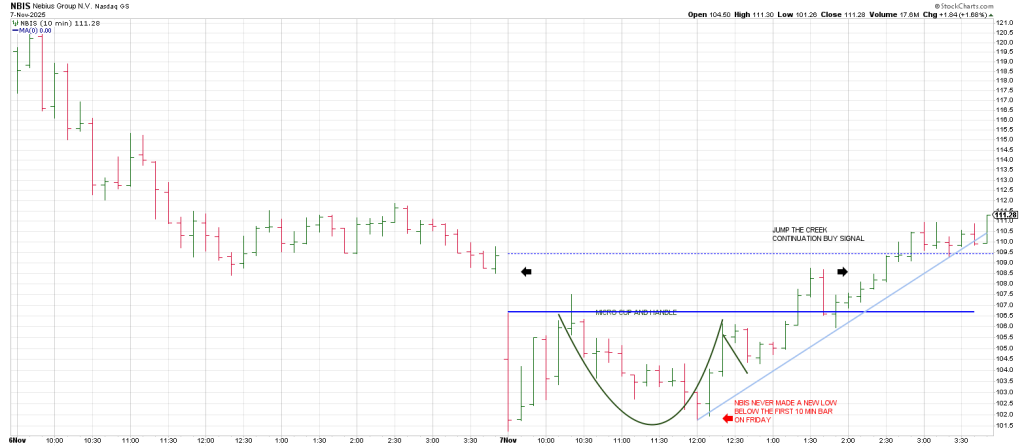
Notice that NBIS never made a new low below its first 10 min bar on Friday. Bullish.
MRVL dropped to trend line support that coincided with horizontal support on Friday morning.
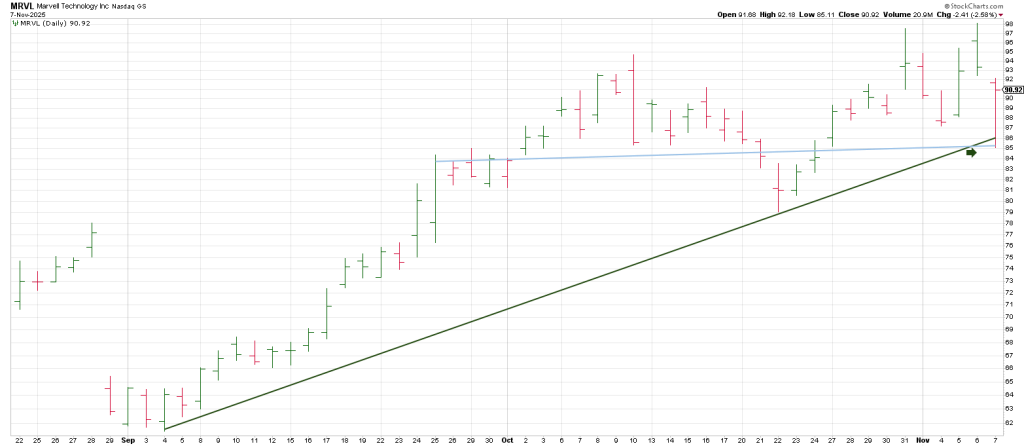
A 10 min MRVL shows my Crouching Tiger (Coil) buy pattern on Friday.
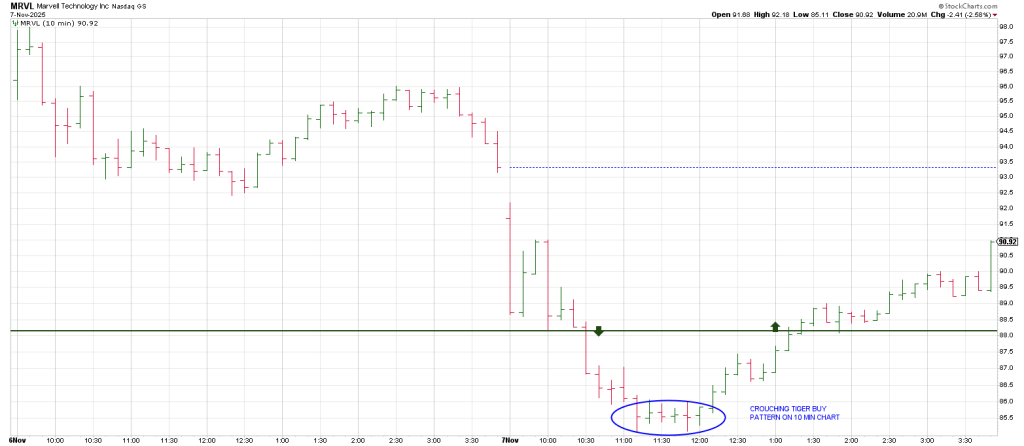
When MRVL pushed back through the Opening Range Break (down ORB) triggering an ORB Reversal, it signaled higher. It had an agenda to the 90 strike after testing 85.
90 degrees up from Friday’s 85 low is 95. It looks like MRVL will open at 95 Monday morning.
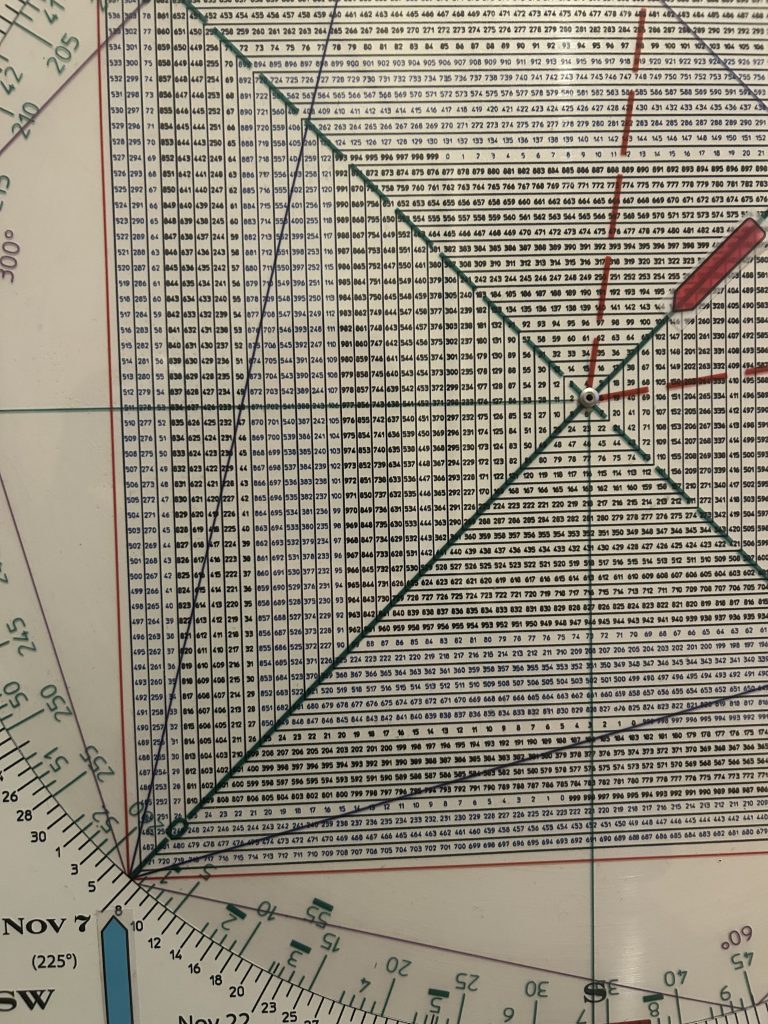
Pictured below is the Square of 9 Wheel, the best trading tool on the planet.
You can go to cooperhitandruntrading.com to grab a free ebook on how it works.

Square of 9 Wheel
Purchase your own Square of 9 Wheel. Shipping to US only. Contact Jeff for shipping outside the US.