If the SPX pattern looks familiar, it should.
On July 31 the index turned its 3 Day Chart down from all-time highs. The next session it gapped down snapping its 20 DMA for the first time since the April low.
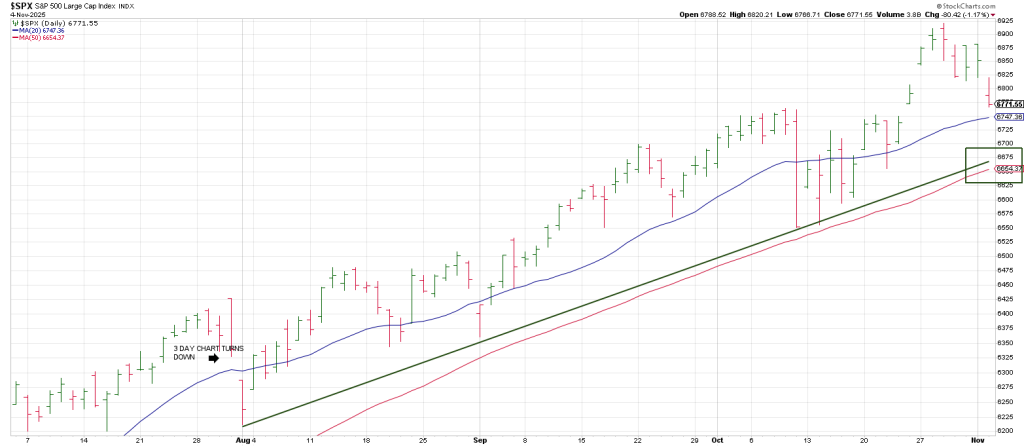
It looked like an unequivocal sell signal opening the door lower.
Except there is nothing unequivocal about a runaway train.
Not only was there no downside follow through, but the SPX turned its 3 Day Chart back up immediately, offsetting the open gap.
This all occurred at the 6300 region. Three months later the SPX struck the 6900 level.
300 points in 3 months…a 1 X 1 angle of ascent.
The moral of the story: setups are just setups, signals are just signals—Follow Through Is Key.
On October 31st the SPX also turned its 3 Day Chart down from all-time highs.
Yesterday it gapped down as well from this 3 Day Chart turn down.
The difference being the SPX remains above its 20 DMA.
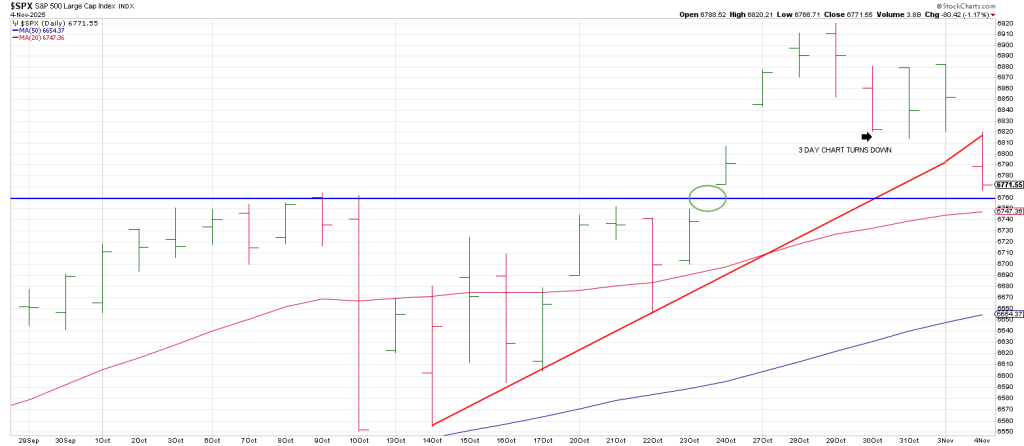
Tuesday’s Breakaway Gap was a setup that did not go unheeded.
It perpetuated a Pavolvian Buy The Dip.
Why?
Tuesday’s gap drove directly to the prior early October all-time highs and the Breakaway Gap from October 24 on a test toward the 20 DMA.
Most importantly Tuesday’s opening smash satisfied a 180 degree decline from the all-time high.
The support zone also ties to a test of a trend line from the important Oct 10th low at 6550 which ties to the first test of the 50 DMA since the April low.
Mr. Market responded in kind with a 68 point rebound in the first hour of trade.
That said the bounce failed with the SPX rolling over to close near session lows.
In so doing it snapped a Bottoms Line from Oct 10.
An hourly SPX shows a picture-perfect back test of an hourly Rule of 4 Sell.
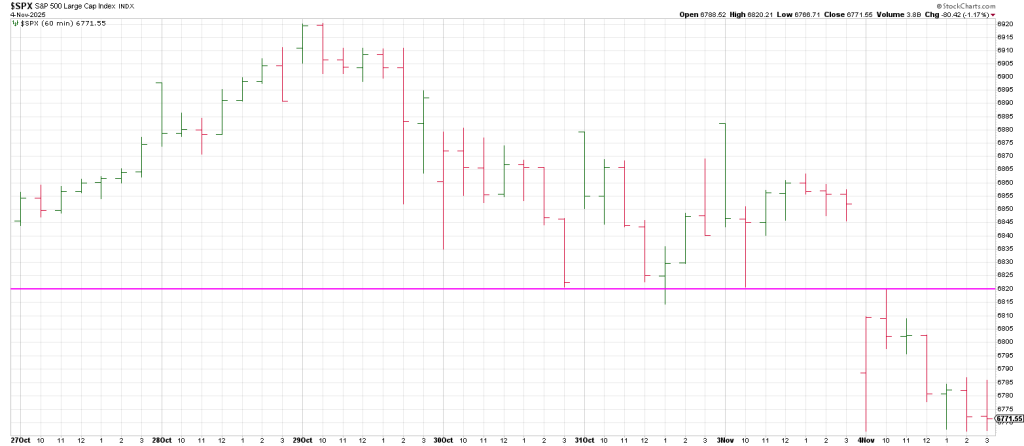
Below Tuesday’s high the pressure remains down.
Moreover below Tuesday’s lows opens the door to 6671(270* down) and 6590 (360 * down).
A 360 degree drop would satisfy a test of the Oct 10 low.
However, it would also snap the 50 day line which currently resides at 6650.
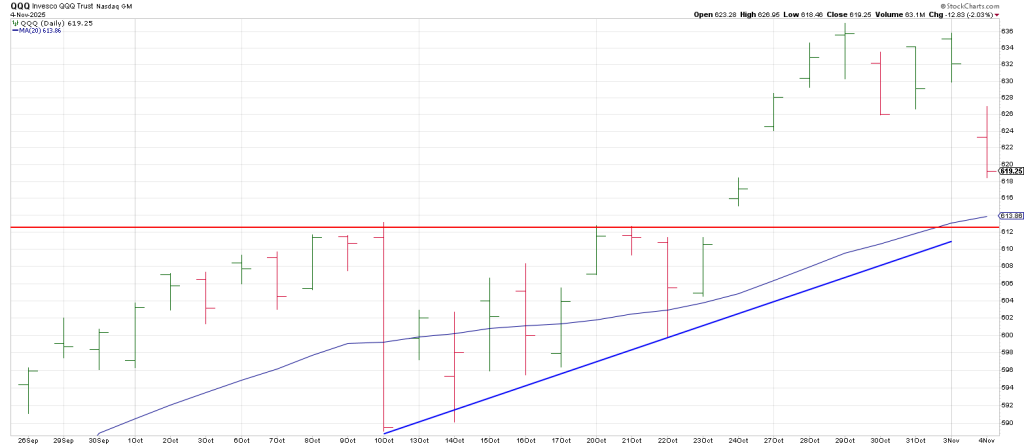
The Q’s have not turned their 3 Day Chart down but show what may be a 6 Day Island Top.
Yesterday’ “panic selling” was Day 7.
For its part the DJIA turned it 3 Day Chat down directly off its all-time high and bearishly followed through.
Tuesday the DHIA tested its 20 DMA and tailed up.
It will be important to see the price action when the SPX and DJIA trace out two consecutive higher daily highs perfecting Minus One/Plus Two sell signals.
In sum Tuesday marked the fourth consecutive Titanic Syndrome warning—a rare cluster that underscores how fragile the market has become.
It is underpinned by indiscriminate selling on earnings in glamours yesterday such as PLTR and AMD.
Market internals wee strikingly weak.
NYSE net advances were -977. NAZ breadth plunged to -2497, one of the most negative reading of this cycle.