“For the floor she found descended and the ceiling was too tall.” Homburg, Procol Harum
The Hindenburg Omen is a rare and controversial market signal.
It is triggered when there is a simultaneous extreme of stocks hitting new 52 week highs and new 52 week lows. Extremes on both ends.
The logic is that internal conflict tends to occur near major market peaks and often precedes sharp declines or crashes over the following weeks.
History shows that such divergence rarely resolves quietly and that the Hindenburg Omen often serves as the final waning before confidence gives way to reality.
There are three conditions:
1) The SPX is above its 50 DMA.
2) More than 2.8% of NYSE stocks hit 520week highs and lows simultaneously.
3) The McClellan Oscillator turns negative, meaning declining stocks are gaining momentum over advancing stocks.
It takes TWO Hindenburg’s in 30 days to get an official HO signaling a sharply elevated probability of a market decline within the next 120 days.
Every major crash since the 1980’s has occurred while a Hindenburg Omen was active—none have occurred in its absence.
While it is a necessary but not sufficient precursor to a crash, its reappearance always commands attention.
Both Thursday, Oct 30 and Friday Oct 31 met the conditions for a confirmed Hindenburg.
Monday we got a third. We have 3 consecutive Hindenburg’s.
According to my studies of 100 years of data, I don’t believe there have ever been three in a row.
In fact I don’t recall ever seeing two in a row.
The Hindenburgs have drawn attention.
Equally telling is the market Titanic Syndrome.
The Titanic Syndrome was developed by analyst Bill Ohama in the 1960’s.
It serves as an early warning of potential market instability.
The indicator compares the number of stocks hitting new 52 week highs versus those making new 52 week lows.
A warning signal is triggered when the SPX is within 7 trading days of a new high while more stocks record new lows than new highs.
Historically, the Titanic Syndrome has preceded several major market corrections, though like many breath-based indicators, it can occasionally issue false positives.
For this reason, analysts often pair it with complimentary measures such as the Hindenburg Omen to confirm high downside risk.
Remarkably, the pattern the last three sessions has produced three successive Titanic Syndrome warnings as well as three Hindenburg Omens.
We know that these can be early warnings versus blaring sirens, but it’s wild that these are occurring going into this key month.
To a blind person on the Titanic, the sound of violins starting up sounded like the party was just starting.
Why did they have a smoking room on the Hindenburg airship?
Caution is warranted.
Complacency may prove costly.
Similar clusters of simultaneous HO’s and Titanic warning have preceded every major market peak of the past half-century…even as late stage rallies and moon shot stocks can conceal the first cracks of a new decline.
PLTR has advanced from 6 to 207 in 14 months.
It reported last night to great expectations and dropped 9 points.
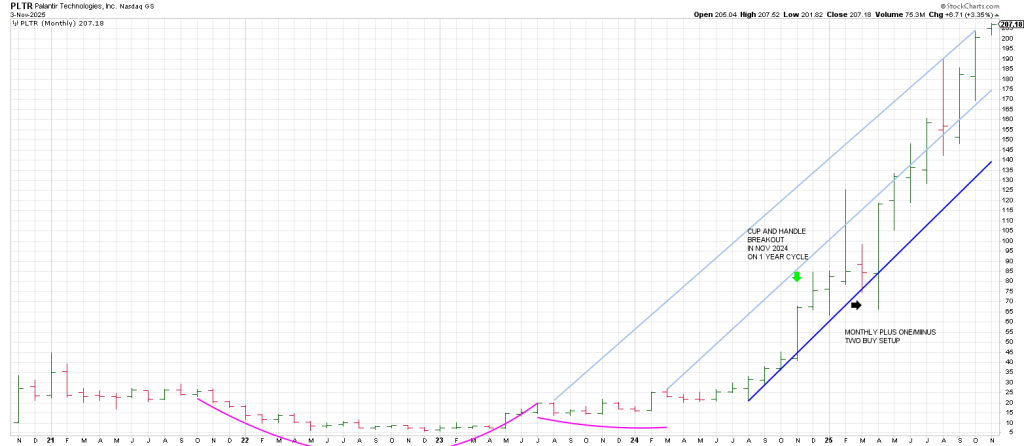
Below 190 is trouble.