“When I get to the bottom, I go back to the top of the slide
Where I stop and I turn an I go for a ride.” Helter Skelter, The Beatles
For the first time in 6 month the SPX experienced a sharp decline of more than 2% last Friday, 10/10.
It was a shot over the USS Equity setting the stage for a week that we said would be highly erratic with the tape resembling a diabolical roller coaster with Price action shifting dramatically intraday and from day to day.
In fact our expectation then was and continues to be that this shape-shifter tape will whipsaw players throughout October.
The reversion to the mean started on cue on the first week of October which is 180 degrees from the April low.
If you’re lost in the forest, not any map will do, you need the right map.
Hit and Run’s daily Roadmap has been killing it.
For example it forecasted rollovers from morning highs on both Wednesday and Thursday.
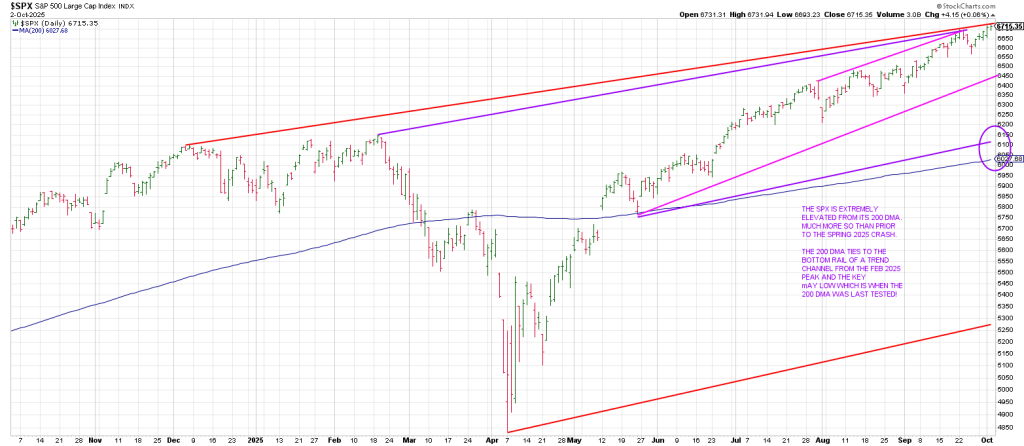
In the October 2nd report we showed a daily trend channel of the which showed a confluence of the top rails of 3 trend channels in the 6750 region saying:
“The SPX is extremely elevated from its 200 DMA, much more than prior to the spring 2025 crash.
The 200 DMA ties to the bottom rail of a trend channel from the Feb 2025 peak and the key May low which is when the 200 DMA was last tested. That level is the 6000 region.”
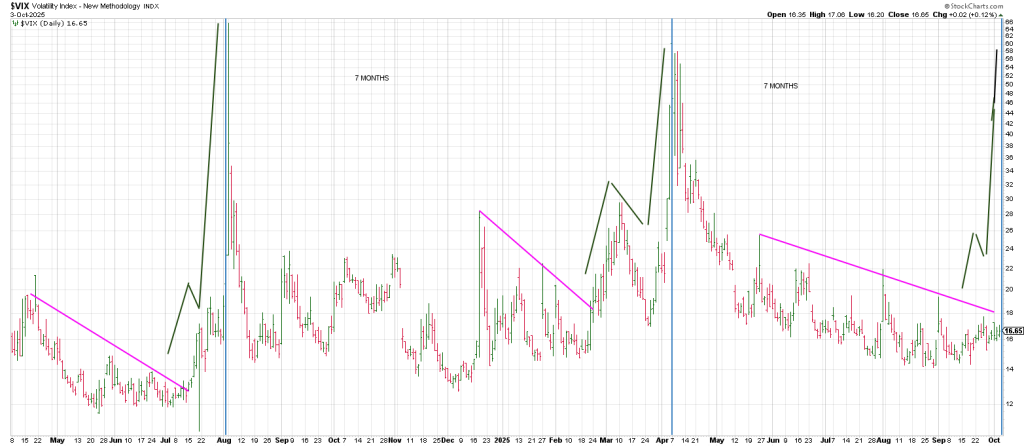
The October 6 report “Buy Volatility” showed the VIX was coiled in a similar position as it was prior to recent spikes (market plunges) suggesting volatility was going to come out of hibernation.
In sum, last week the SPX carved out a Key Reversal Week,
It has not yet turned its Weekly Swing Chart down, on trade below last weeks low
It could do so today.
The last Key Reversal Week was the week of 7/28/25
Not only did it not produce trade below that weeks low, the SPX shrugged off the KRD perpetuating
A stunning 550 point rally in 10 weeks.
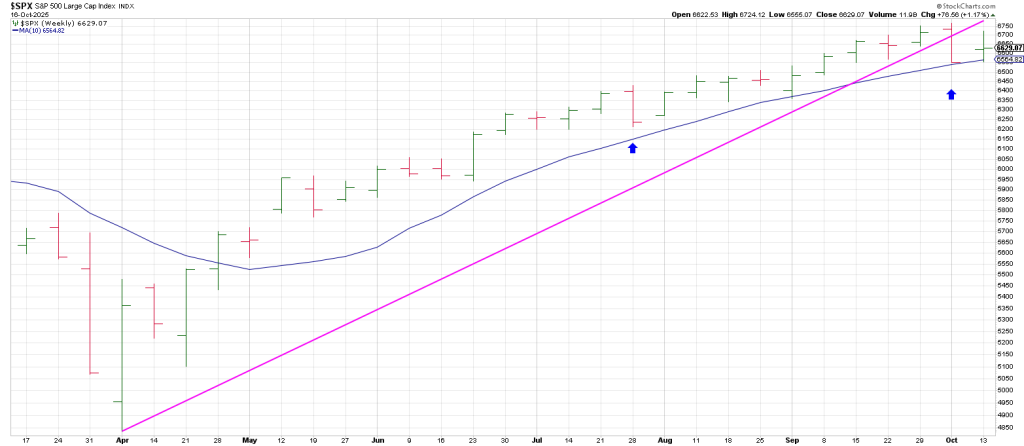
Notice how the 10 week moving average has held support throughout this melt-up.
Breakage of the 10 week ma in tandem with downside continuation below last weeks low opens the down door.
While in recent years October has not live up to its reputation for scaring the daylights out of market participants, this October is 96 years from October 1929 and 96 squares late Sept, the high weekly close so far on the SPX.
It’s concerning that many newsletter writers seem to be calling for this little sell-off to be a bear trap prior to the “real” melt-up ala 1929.
That’s exactly what you’d expect: the crowd to hum for more after a smorgasbord of momentum.
So the 1929 point rally (you read that right) from the April low was not a real melt-up?
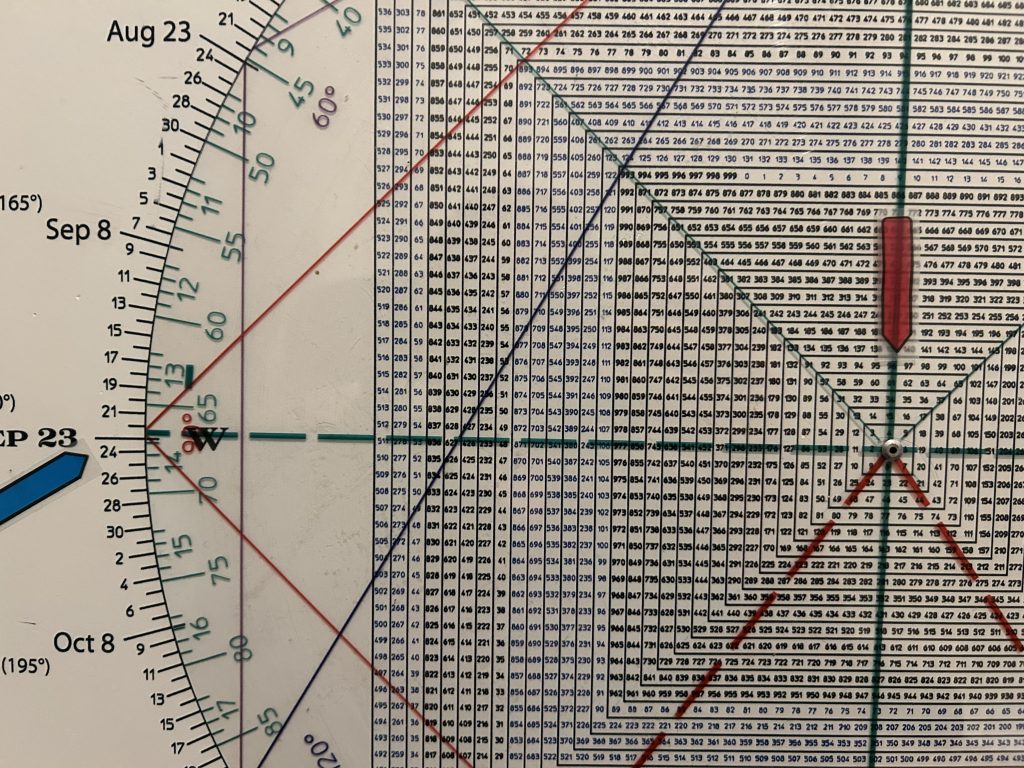
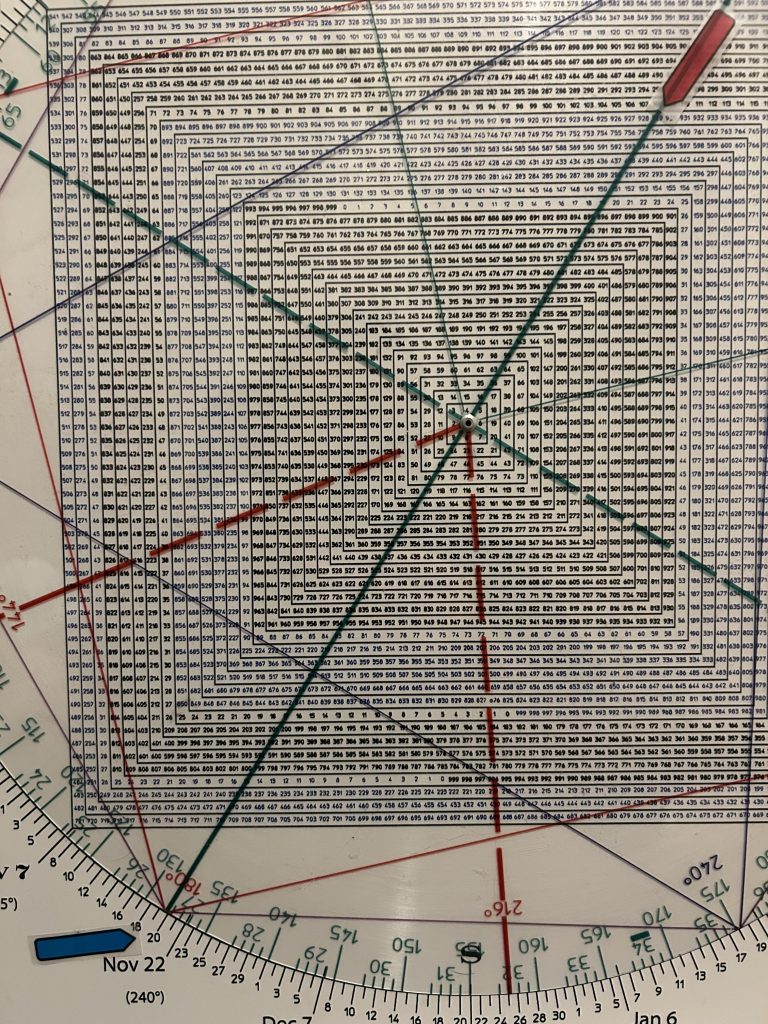
Interestingly, ‘1929’ on the Square of 9 Wheel is opposite November 20th.
The low in 2008 and + or – 1 week from the low of the year in 1929.
Some say a crash is unlikely because so many people are saying it’s a bubble.
That’s a giant game of double-think.
You can take the unusually vicious whipsaw action as evidence that investor psychology has synched to 1929.
The Smoot-Hawley tariff laws under consideration at the time were obsessed over.
Today, it’s just TACO trading.
While many attribute last Friday’s plunge to more Trump art of the deal with a direct link between Trump retaliatory threats and the stock market’s plunge, in truth the news breaks with the cycles, not the other way around.
It is the cyclical forces that drive the market’s major swings themselves that actually color our perception of the news.
In other words the stock market is/was ready to fall.

Square of 9 Wheel
Purchase your own Square of 9 Wheel. Shipping to US only. Contact Jeff for shipping outside the US.