A daily SPX shows the 3 Day Chart turned down on Sept 25 in tandem with a test of the 20 DMA for
A Holy Grail/ 1 2 3 buy setup.
It perpetuated a quick 150 point rally in 10 trading days.
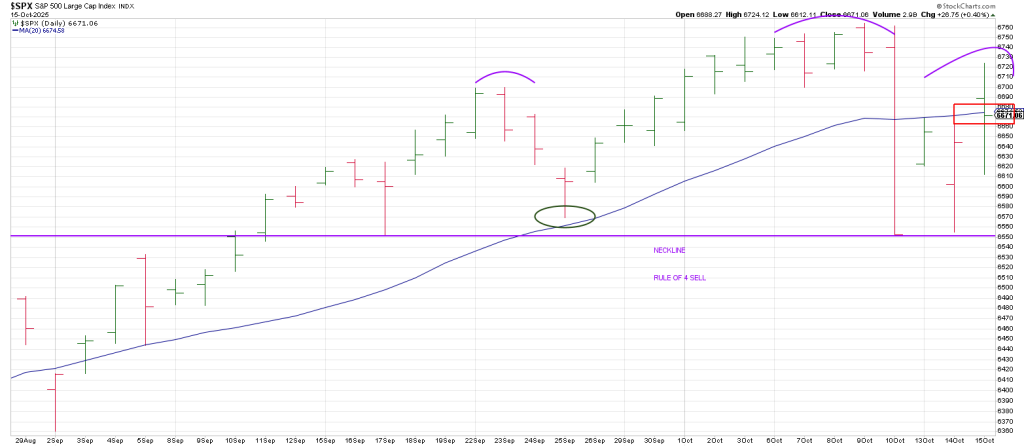
So September 25 became the “circled” 3 Day Chart low.
It was broken with last Friday’s knife down turning the 3 Day Chart back down.
Friday’s low ties to what may be the Neckline of a Head and Shoulders top pattern traced out over the last 3 weeks.
You see there are 2 ways to turn the 3 Day Chart down, taking out a circled 3 Day Chart low and
3 consecutive lower daily lows.
The SPX carved out 2 consecutive higher daily highs yesterday putting it in the Minus One/Plus Two sell position.
The market responded to the bearish setup by dropping 112 points in 3 hours before rebounding.
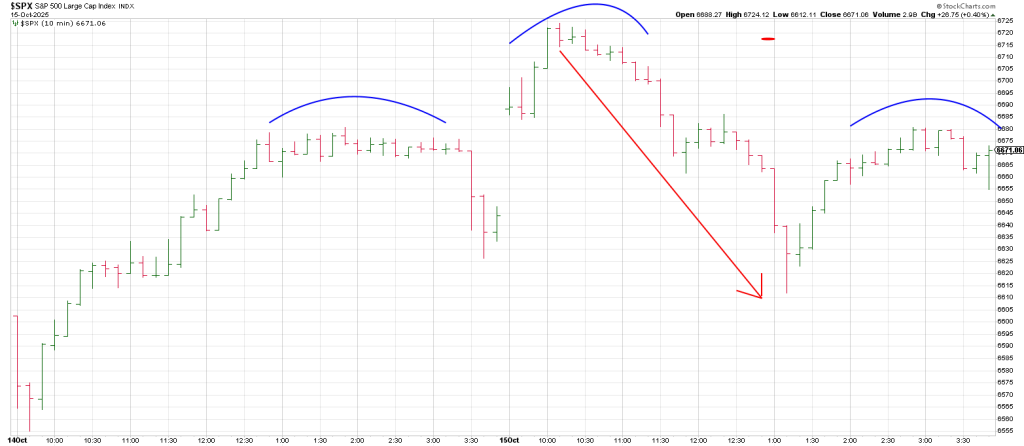
The rebound ripped to the top of the gap window from Wednesday morning.
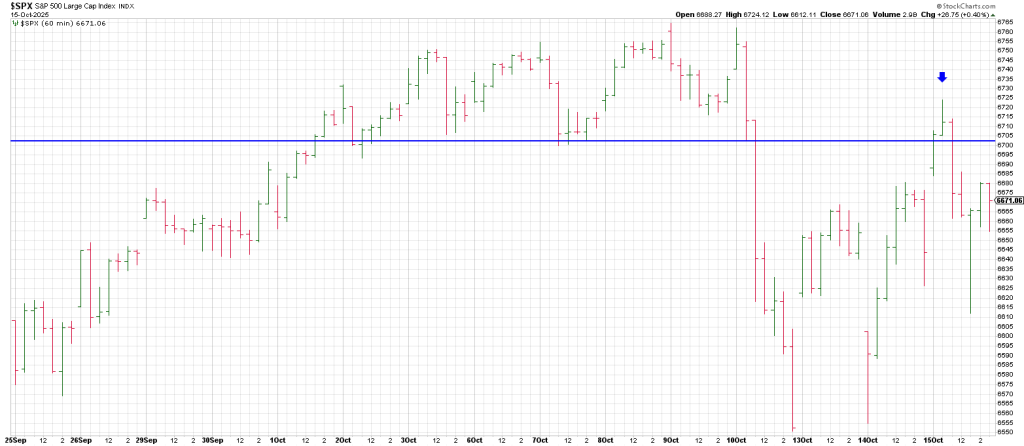
An hourly SPX shows clear-cut short term resistance
My statement at the beginning of last week that the month of Oct will see intense and relentless swings in a reversion to Mean Mr. Volatility is playing out in spades.
The anomaly of late is a rising VIX alongside a rising SPX.
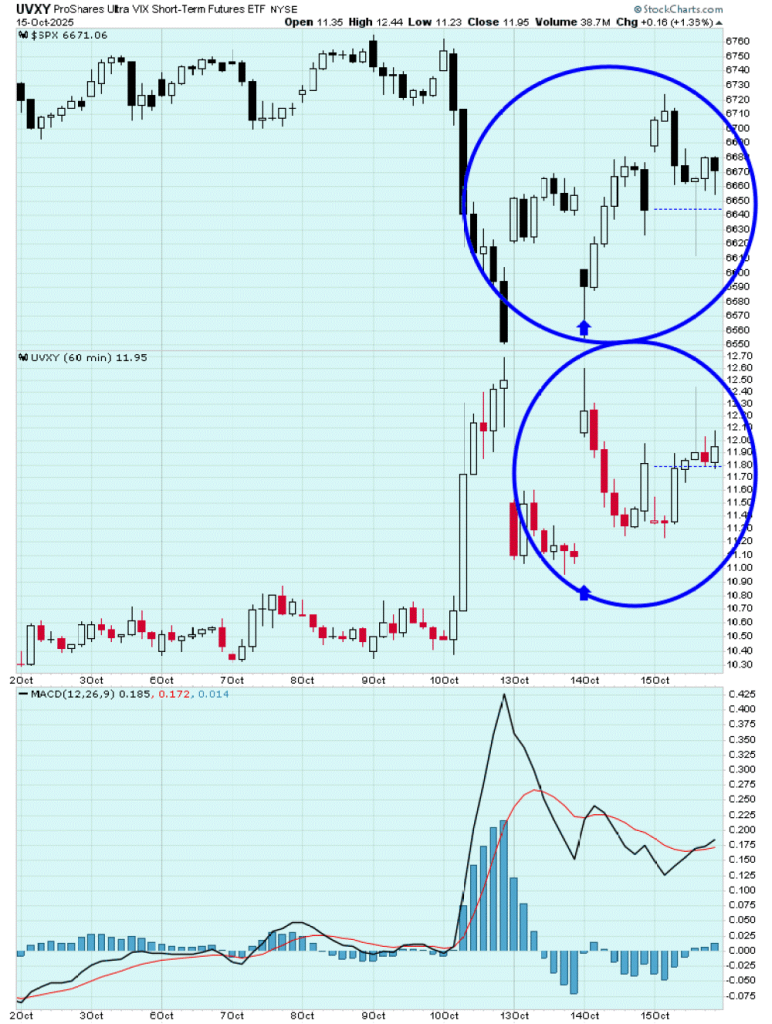
At the same time the string of negative McClellan Oscillator readings and falling Summations continues.
In sum the SPX attempted to recapture its 20 DMA but fell back below it on the close.
Did Wednesday’s high put in a bearish Right Shoulder?
As long as we remain below Wednesday’s high the pressure remains down implying October has more downside.