Yesterday I mentioned that the week should be highly erratic with trading conditions likely to shift abruptly.
The template tweeted out was to think about March 2020/Covid with large down days followed by
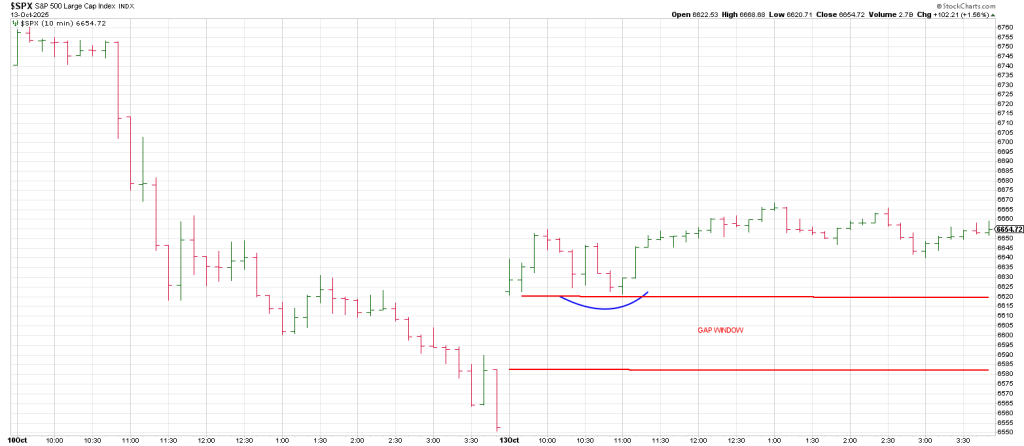
Gap up rallies that close on their high only to gap down the next day for a large decline, closing on session lows.
Monday appeared clear that following a W Bottom into 11:30 that the market would hold up closing near session highs.
That would set the stage for a gap down today.
A drop from Monday’s highs could be a C Wave decline in the scope of a corrective (bullish) scenario.
In other words A down Friday, B Up Monday, C down today.
An initial A B C could be part of a lager A down followed by a lager A up and then a larger C Wave decline all within the context of a corrective posture.
That certainly fits with the relentless roller coaster implied by Mr.. Roadmap this week.
Alternatively, we have a bearish Wave 1 down and are tracing out a Wave 2.
That will lead to a powerful Wave 3 decline which will see new lows below Friday’s lows.
Remember 180 degrees down is 6600. The SPX undercut that Friday to test toward its 50 DMA.
The 50 DMA had not been tested since reclaimed o May 1st.
The normal expectation for the first time down is a rebound an boy did we get one.
Remarkable move in names like ARM AVGO BE SNDK to mention a few.
Given the Angle of Attack to the downside it is a reasonable expectation that we get a 360 degree decline off the high at a minimum, bullish or bearish.
360 degrees down is 6438. That’s not even a test of the rising 20 week MA which is currently at 6382.
A cube down gives 6279 which is not even a test of the 6147 Feb 2025 peak.
Remember the April low of 4385 was a picture perfect test of the Jan 2022 top.
Even in the context of a continuing bull market a test of the prior major high (6147) is theoretically
Reasonable: prior resistance becomes new support.
Consequently, we may see 720 degrees down from high which is 6121.
Almost exactly in line with the February top of 6147.
Said another way the early October high is 720 degrees or two 360 degrees UP from the February high. Perfect math.
It also means we must closely watch the behavior at 360 degrees down at 6438.
You don’t see the significance of 6438 until you look at an hourly SPX from August 29/Sept 2 where there is a little hourly Island Bottom which perpetuate a powerful rally.
In sum it will be important to see the behavior by the SPX at yesterdays open gap which run 6604 to 6620.
The SPY overnight as I write has already dropped into this gap.
Continuation through it is a Jump the Creek sell signal opening th down door.
The first week of November is a red letter week which I’ll go into in tomorrow’s report. Price squares out then at 6250 region.