“We put thirty spokes together and call it a wheel; but it is on the space where there is nothing that the utility of the wheel depends. We turn clay to make a vessel; but it is on the space where there is nothing that the utility of the vessel depends. We pierce doors and windows to make a house; and it is on these spaces where there is nothing that the utility of the house depends. Therefore just as we take advantage of what is, we should recognize the utility of what is not.” CG. Jung, Synchronity: An Acausal Connecting Principle
“There is a definite relation between TIME and PRICE. By a study of TIME PERIODS and TIME CYCLES you will learn why tops and bottoms are found a certain times and why Resistance Levels are so strong at certain times.
THE MOST MONEY IS MADE WHEN FAST MOVES AND EXTREME FLUCTUATIONS OCCUR AT THE END OF MAJOR CYCLES.” WD GANN
“And when Monday comes ‘round, there’s a high lonesome sound
And she follows you down for the kill
And a white, blinding light makes it all seem so right
And you feel like the king of the hill.” Roger McGuinn, King of the Hill
Some say Friday’s Swan Dive was completely unexpected, that technical analysis showed zero signs of danger. In short, we are told it was impossible to predict.
Hit and Run members know differently.
They know because the market is not a Random Walk—that markets play out according to Time and Price harmonics in keeping with WD Gann’s Law of Vibration.
As Gann wrote, “all important turning points are square-outs in time and price.”
“Synchronicity is the coming together of inner and outer events in a way that cannot be explained by cause and effect and that is meaningful to the observer. Synchronicity is an ever present reality for those who have eyes to see it.” Carl Jung
Maybe something, maybe nothing, but from the April 7 low of 4835 to last weeks 6864 record high is 1929 points.
Is the Universe giving Mr. Market the middle finger?
There are square-outs and there are SQUARE-OUTS.
In other words square-outs based on the annual trend and square-outs based on historic turning points.
Recently we took a look at some historic busts in the month of October (and where they started in early October) noting that October often sees panicky selling as it is 7 months from the natural beginning of the year, the Vernal Equinox on March 21st—7 being the number of panic according to Gann.
Speaking of “7’s” we have the Panic of 1907.
1907 squares October 13, today.
Let’s pull back the lens and see how the fall of 2025 is synergistic with some monumental busts.
Tulip Mania which lasted around three years saw an historic bust in January 1637.
Markets play out in three’s and we are three years from the October 13 bear market low.
If for no other reason, this warranted caution in a market that has not had a correction since the April low.
But back to tulips.
From 1637 to 2025 is 388 years.
388 squares October 10.
Tulip Mania climaxed in January 1637, which marked the greatest influx of new florists coincidentally.
At an auction the first week of February 1637, the boom ended at a failed auction.
With the auctioneer unable to find a price at which bulbs would sell, speculators who had bought bulbs on margin panicked.
“The market for tulip bulbs simply ceased to exist” Tulipomania reports.
I remember coming home from grade school one day in May 1962 and walking into my dad’s home office to find him upset.
I asked what was wrong.
He said he was long some stocks that were dropping sharply.
I said why not just sell them.
He replied, “To whom?”
When markets collapse speculators catch the whiff of the Margin Man.
Would be buyers fade into the background like Homer Simpson into his hedges.
My dad called it a “Towhoma”.
With no predictability or stability markets become unsustainable.
Said another way: volatility preceded price.
Recent volatility may not be notable in the indexes, but individual stock volatility has been off the charts.
For example DELL, ARM, DDOG, CRWV and TEM to mention a few.
Interestingly anchoring zero on the Sq of 9 Wheel to the Tulip Mania top, the year 1637, squares out with November 13…
The crash low day in 1929.
The top of the South Sea bubble was in 1720.
On the Square of 9 Wheel 1720 squares out with November 11.
1720 was 305 years ago.
On the Square of 9 Wheel, 305 squares Oct 24…the day the Great Crash started in 1929.
The low of this 90 years/90 degrees + Super Cycle was 1932.
93 years ago.
On the Square of 9 Wheel, 93 squares October 24, the day the Great Crash started in 1929.
To see how this law of vibration works.
Anchoring zero to the year 1987 shows that that fateful year squares October 29th.
In other words if you owned a Square of 9 Wheel in 1987 and recognized not a similar pattern but an almost exact pattern to 1929 was unfolding you would have seen that the year 1987 vibrated/squared October 29th—the Big Kahuna.
That would have given you confidence and made you a bloody fortune.
As well, it is 58 years from 1929 to 1987.
On the Wheel 58 squares October 29.
58 also vectors 93 and we are NOW a synergistic 93 years from 1932.
The DJIA record high in 1929 was 386.
386 squares October 19.
If one had known this in 1987, it would have been one more clue pointing to a crash
The year 1929 is opposite November 20. That is 7 weeks from this weeks high.
A time period to watch similar to that of 1929 and 1987 crashes counting from the high.
1929 was 96 years ago. 96 squares September 22/23.
This year that was a Solar Eclipse piggybacking the Autumnal Equinox…two natural cycles.
In fact September 22nd 2025 marks the high of a 14 trading day run—the longest stretch since the April low.
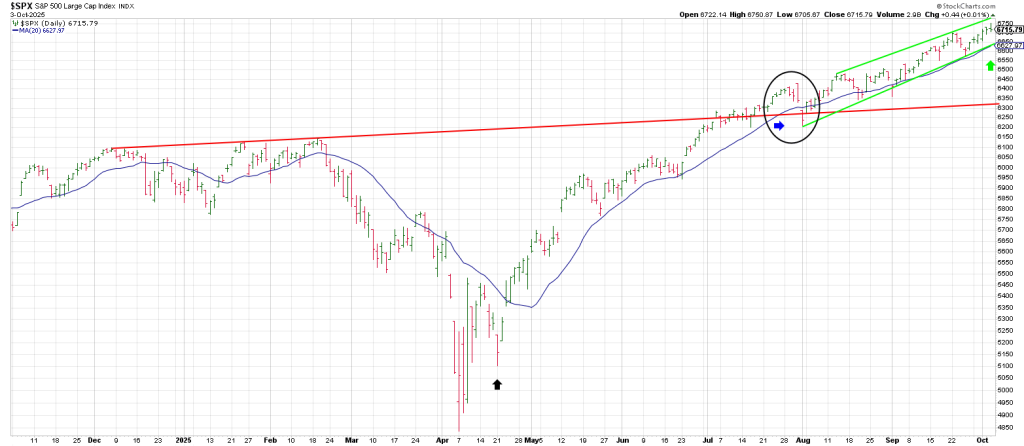
Following the September 22 peak, the SPX 3 Day Chart turned down after which a nominal new high played out.
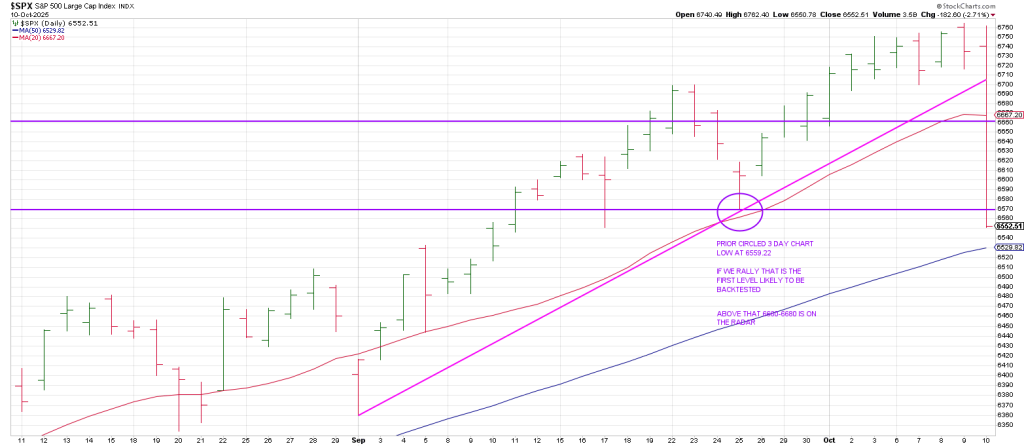
As I noted at the time, breakage below the 3 Day Chart low on September 25 (which tied to another test of the 20 DMA) would be a conspicuous change in character.
Why?
Because no 3 Day Chart circled low has been violated since the April low.
Doing so would produce a daily Time Trend Turn indication (versus weekly).
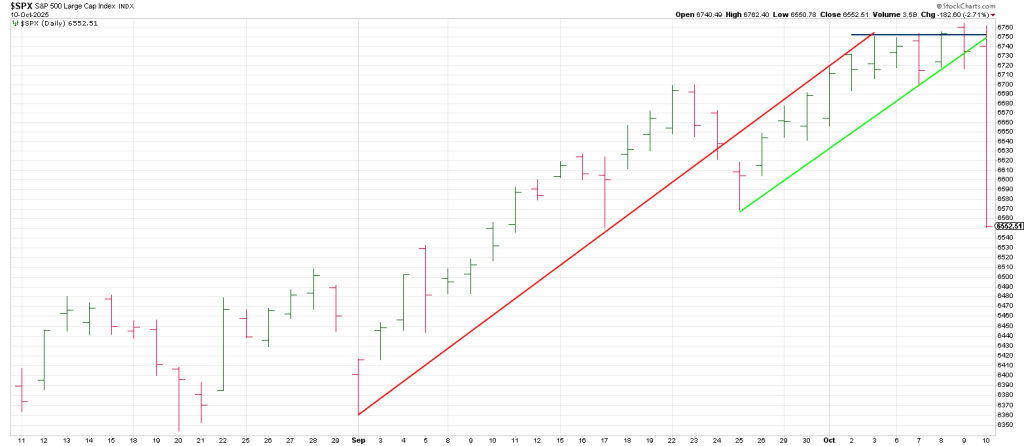
Well the 3 Day Chart circled low (6569.22) was broken with authority on Friday.
On cue, the SPX continued lower, closing at 6552—just above its 50 DMA.
The SPX 50 DMA has not been tested since it was reclaimed in early May.
It will be interesting to see what the first test of the 50 perpetuates—a rebound or panicky selling.
Typically the first time a market does something in a long time—such as test/undercut an important moving average— the normal expectation would be for a bounce.
The likelihood is a bounce.
If for no other reason than October 7th is 90 days/degrees from the April 7th low and we had not seen a correction, the normal expectation was to expect something to come out of the blue.
Why out of the blue? Because markets don’t exist to accommodate and offer a graceful exit.
Market participants were not expecting a plumb-line drop but prices kept drilling lower on Friday.
They should have been expecting “something” this week because Tuesday the SPX carved out a Key Reversal Day and the previous Friday left a signal Reversal Sell bar—a 10 Day Topping Tail or what I call a Lizard.
To read that there was no technical reason to expect the bear to put some wood on the ball is wild.
But as recent freebie reports have shown there was more than a cluster of cycles suggesting a change in trend.
There was price symmetry.
From the 483 (4830) April low, 360 degrees up is 575 (5750). Another 360 degree synergistic advance is 675 (6750).
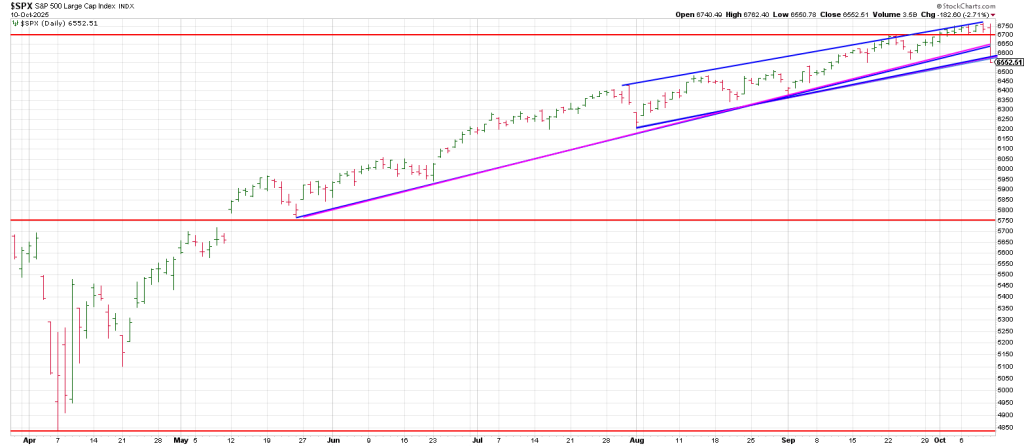
Notable is the massive gap above 5750 on May 12th proving the geometry.
The SPX hit its head on 6750 for 6 consecutive days and reversed with the largest down day since the April low taking out 21 trading days of price in one fell swoop.

Friday snapped a trend line from the June low leaving an outside down Key Reversal Week in its wake.
The SPX left an outside down week at the end of July which saw no follow thru.
Follow thru is key.
An impulsive (5 little waves) decline following a bounce off this test of the 50 DMA suggests the top is in.
Prior to the July weekly reversal and last weeks weekly reversal the last KRW was the week of July 15, 2024. The SPX skidded lower for 3 weeks turning the important 3 Week Chart down.
From my perspective the 3 Week Chart will turn down. This entails 3 consecutive lower weekly lows.
If that plays out, the subsequent behavior will give us much information as to what Mr. Market’s got up his sleeve.
In sum, October 2022 saw a bear market low.
October 2023 defined a low.
When the SPX broke the little pullback low from late October 2024, in March 2025 it crashed into a low 6 months later in April (from the Oct 2024 low).
What markets do here this October and this quarter will have a lot to say about how the expected bust in 2026 plays out.
Why are all the above factors pertinent to caution in the fall of 2025?
1) In addition to the synergistic time/price harmonics spelled out above, 2025 is the 43rd year of a secular bull market
On the Sq of 9 Wheel 43 squares the year 2025. As well, both align with November 7.
2) We are 38 years from the crash of 1987. On the Square of 9 Wheel 38 is 180 degrees straight across and opposite October 24th—when the Great Crash started in 1929
Conclusion. The Hit and Run Private Twitter/X Feed provides a Roadmap each morning for that day.
The gist of the Roadmap for Friday was…An opening high at 9:45. A sharp selloff is projected into the last hour.
Thursday’s report “Reversion To The Mean in the Crosshairs Following 20 Week Vertical Run” was timely. It ended saying, “If the dominoes fall to the downside producing reversion to the mean,
we could yet see a Red October—just as euphoria is all dressed up to gift the bulls with what they assume will be a non-stop melt-up into January.”
Wednesday’s report flagged that “This week squares-out with 660 (6600), so that may magnetize the market lower (into OpEx).
We followed that up with an alert to members on the Hit and Run Private X/Twitter Feed on Friday morning
That’s a pretty wild call with the SPX trading at record highs at 6750 with 2 days to go.
Hit and Run members were in position with puts.
SPY Oct 10th 665 Puts entry 2.07 sold AT 11.50
QQQ Oct 17th 600 Puts Entry 2.80 closed 12.80
QQQ Oct 17th 605 Puts Entry 4.05 closed 18.00
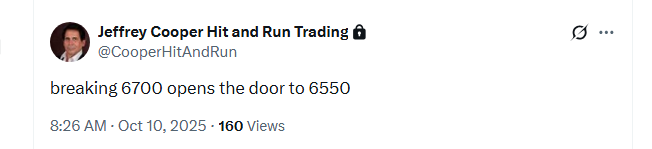
In fact the SPX closed at 6652, undercutting 6600 theoretically opening the door lower in coming days.
The Squares from the all-time 6764 high are:
90* down = 6681
180* down= 6601
270* down=6520
360* down =6440
540 * cube-out = 6280
Clearly 180 degrees down was broken and on the Friday weekly closing basis, opening the down door lower. A knee-jerk bounce to 90 degrees down from high at 6681 is on the table if we gap up.
The September low is 6360.58. Trade by 1 tick below that in October turns the Monthly Swing Chart down. Notice that 540 * down is at 6280 below the September low.
Downside follow thru below the important 360 degree region of 6440 suggests the Monthly Swing Chart will turn down in October.
The behavior if the Monthly Swing Chart turns in October or November will give us valuable information about the market and whether there is going to be one last ditch rally.
A daily SPX from last Monday’s report entitled simply, “Buy Volatility”, shows a Ghost Line from the December 2024 internal high and the Feb 2025 external high ties to 6300 in October.
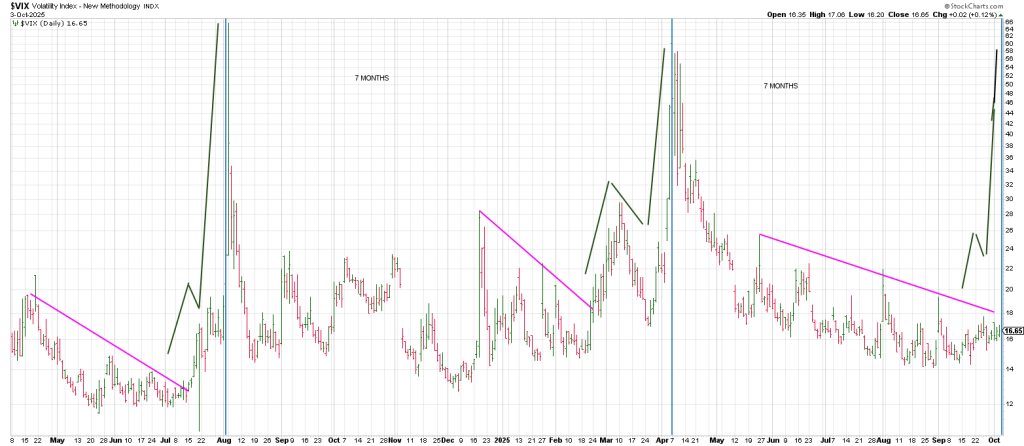
This indication is backstopped by a VIX daily from the same report.

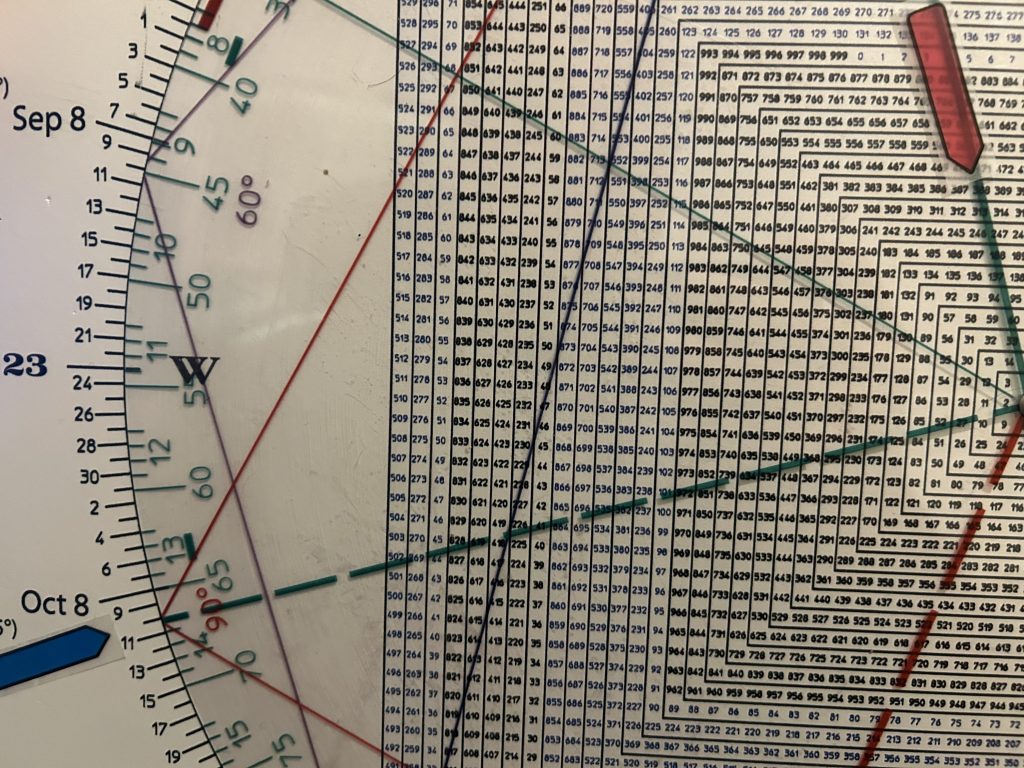
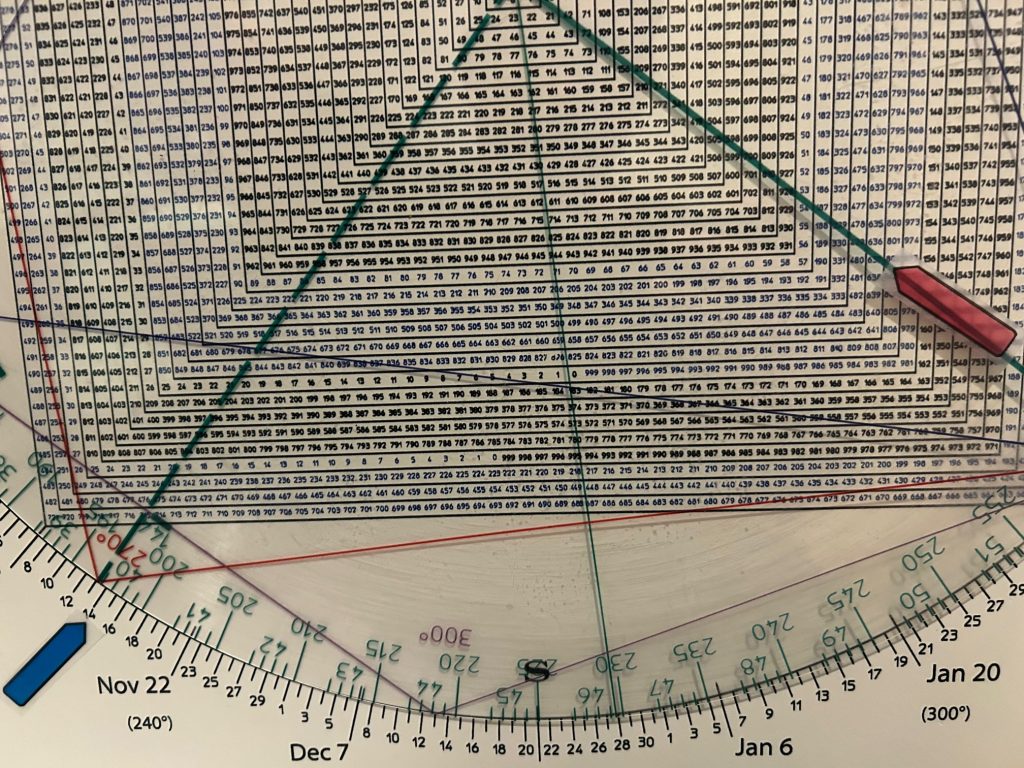
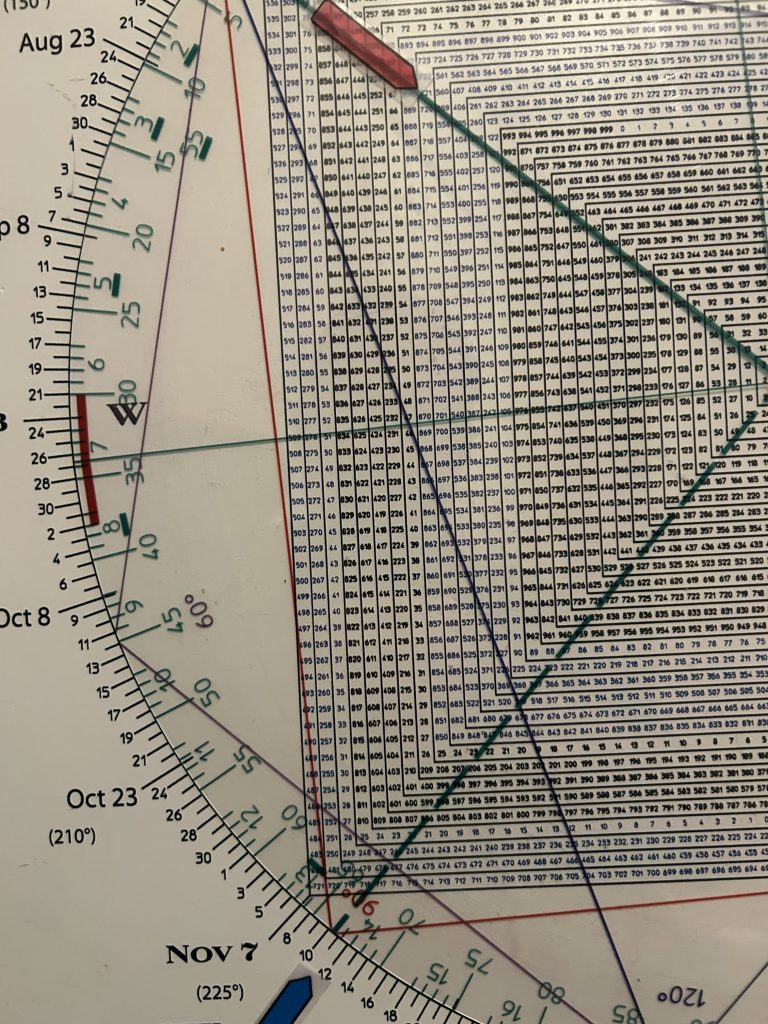
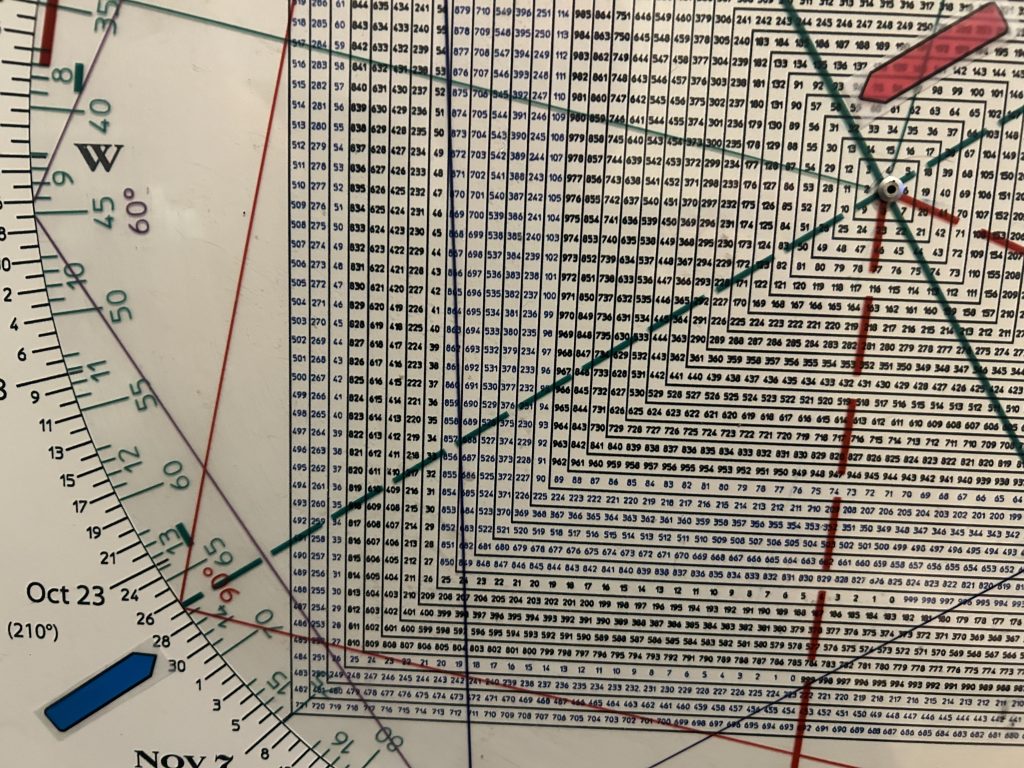
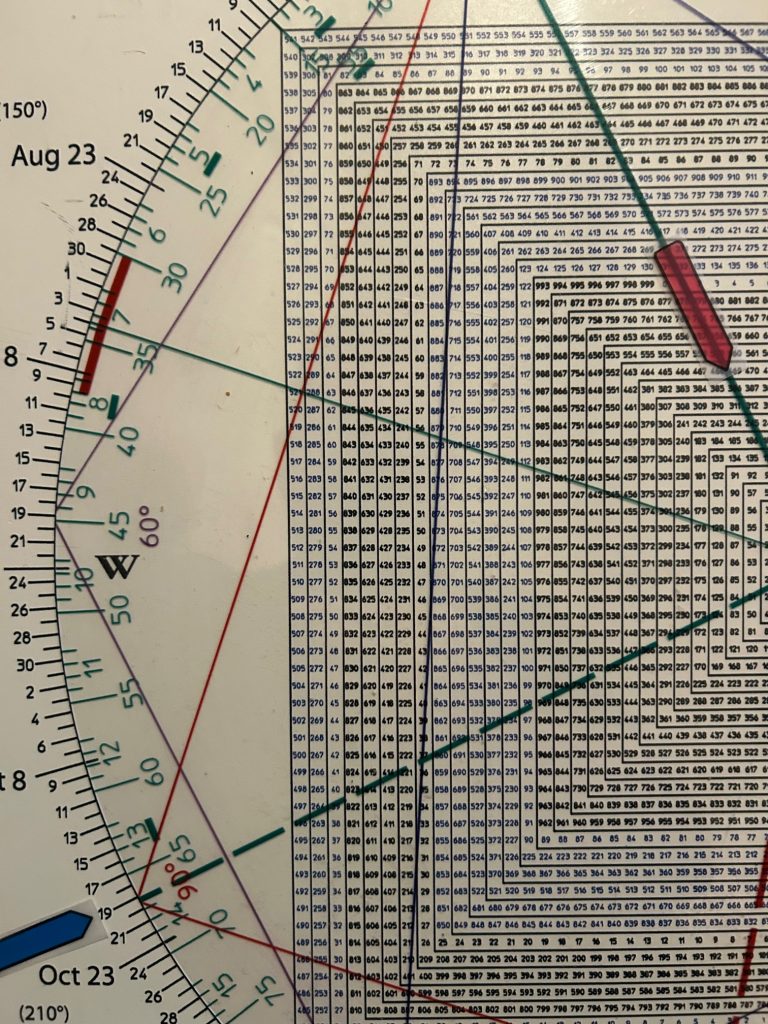
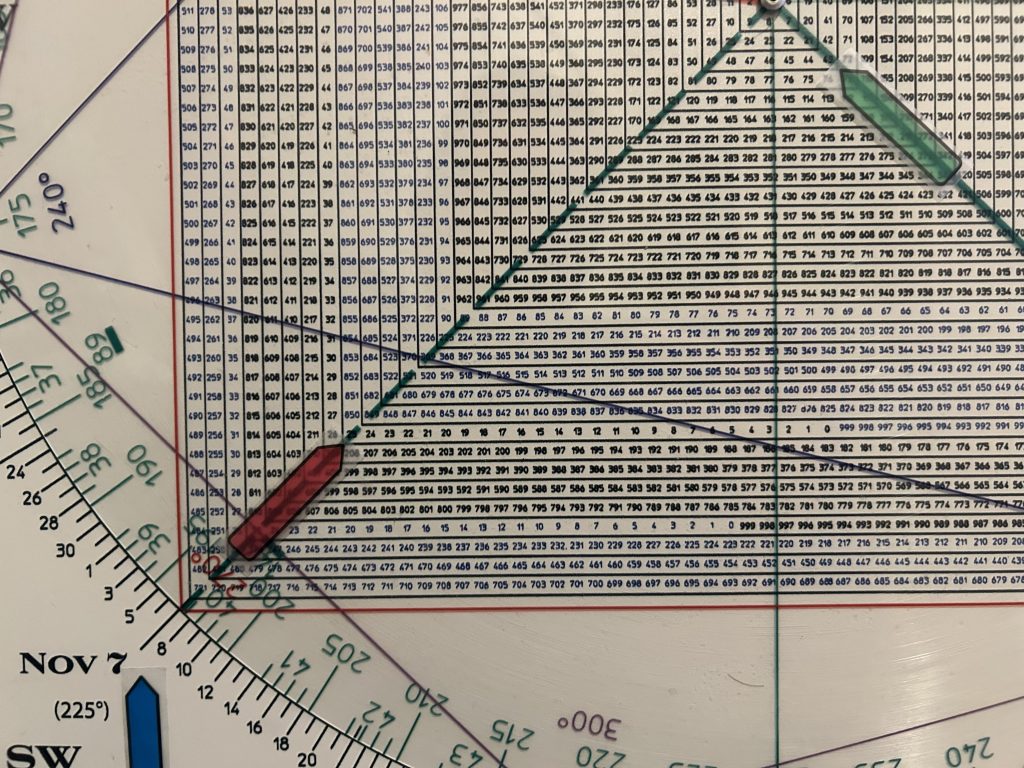
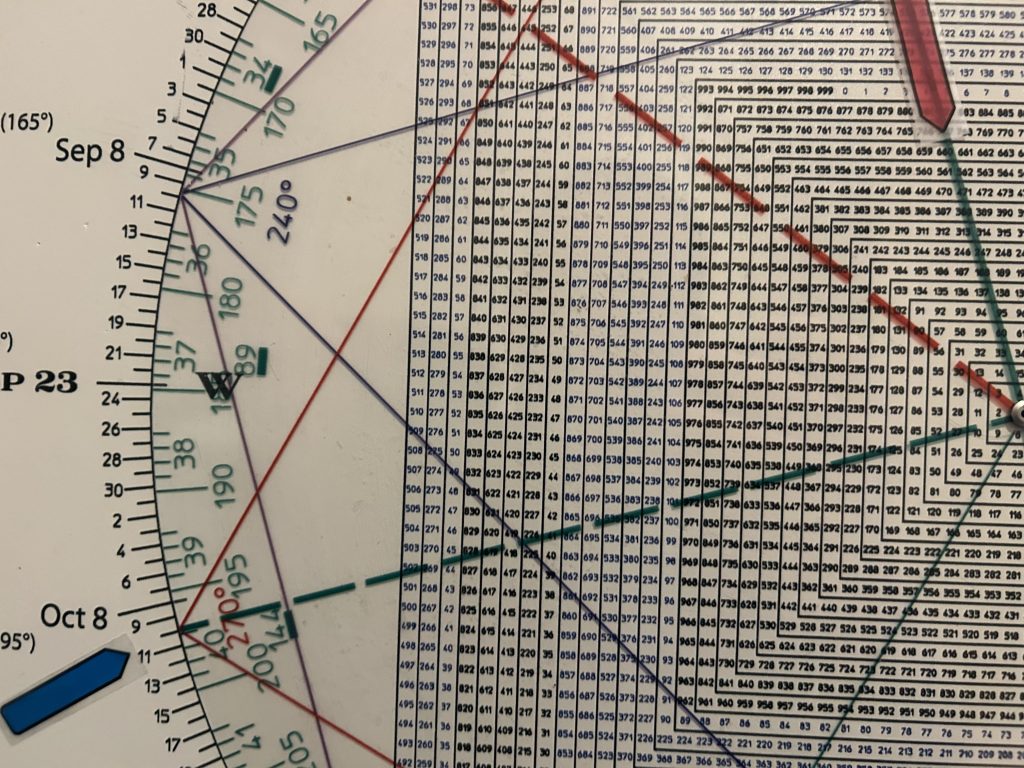
Square of 9 Wheel
Purchase your own Square of 9 Wheel. Shipping to US only. Contact Jeff for shipping outside the US.