“What’s your name? Who’s your daddy?” Time of the Season, The Zombies
Autumn is known for crash season…1929, 1987, 2001, 2008.
We have an interesting setup starting from Sept 21-23.
We had a new moon on Sunday September 21st and often the crash pattern can be started from a fall new moon—especially in the fall.
We have the Solar Eclipse on September 21, 2025
We have the Autumnal Equinox on September 22.
We are 96 years from 1929 and 96 squares-out with September 23 on the Square of 9 Wheel.
Why do we get fall crashes?
One reason is that March 21st is the Gann Zero Point, the natural beginning of the year and September 21st is opposition the Spring Equinox and October is the SEVENTH month from March…
7 being the number of panic.
There are two scenarios I’m looking at:
1) We waterfall into mid-November, 7 weeks from high…the Gann Panic Zone.
2) We have a Primary High here and a shake-out and then a Secondary High in November…a 6 to 7 week Topping Pattern.
Numerous sectors of the market are experiencing blow-offs such as the metals and certain tech stocks such as SNDK and STX.
While the vast majority of investors seem to be unaware that inflation funs rampant throughout the financial markets.
The new record in outstanding margin debt serves as a primary example.
This was one of the culprits in 1929.
Even more worrisome, the ratio of margin debt relative to free credit balances. Rose to a new record last month. This means that margin traders are taking increasingly risky bets, with reduced collateral supporting their trades if stock prices turn lower.
This is one of the reasons why crashes happen, it’s not just that sentiment turns on a dime (although it often does) it means that a market that drifted lower reaches a juncture where if it goes lower, The Margin Man gallops into town.
What could cause the “unexpected”? While we don’t typically deal with “causes”, sometimes cause and effect dovetail at momentous turning points.
A government shut-down next week might act as the straw that breaks the camel’s back.
In betting markets the probability of government shutdown has risen to 80%.
With political bitterness running high, the risk is this time is different and the compromise that complacency expects doesn’t happen.
While 6699 (669) squares-out with Sept 3, the 1929 high and clearly mirrors the March 6, 2009 bear market bottom, there is not a square-out from the 4835 level here.
Nor is there a square-out with the April 7 low.
However, moving the decimal point and using 483 (from the 4835 April low) shows that 575 or 5750 is 360 degrees up.
720 degrees up is 675 or 6750.
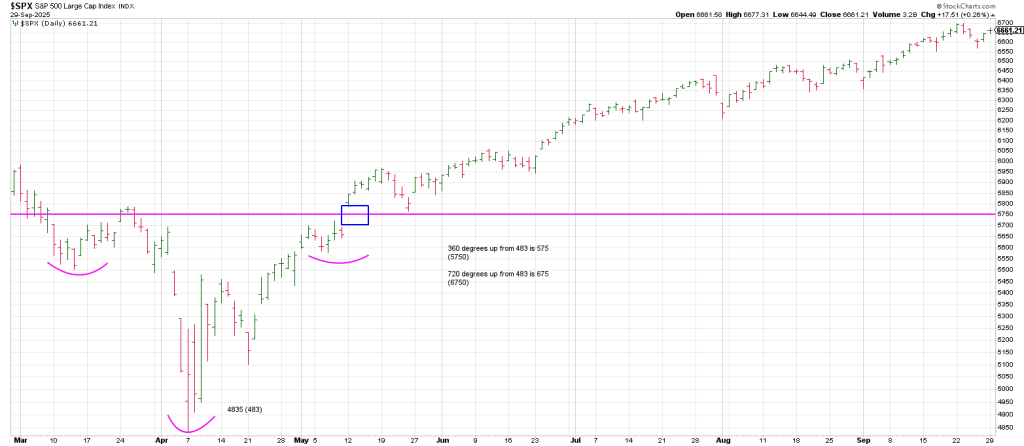
What’s interesting is that the SPX gapped with authority above 5750 on May 12th.
It has never looked back.
By that I mean every turndown of the 3 Day Chart has defined a low.
It is possible 6750 is struck this week or more likely I think that we get a solid correction which opens the possibility for 6750 to be struck in November.
Once reason I say that is because 675 is 180 degrees straight across and opposite November 14 (+ or -).
We already know that November has a lot of time/price synergy.
November 13 is also the low day of the crash in 1929.
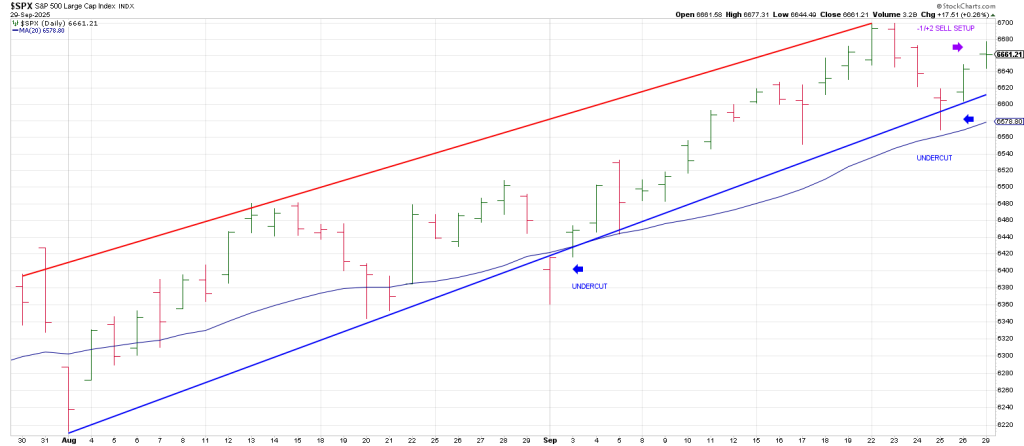
In sum, today looks pivotal.
The SPX/QQQ is in the daily Minus One/Plus Two sell position.
While the market surged on the open, the Roadmap projected a reversal and the SPX actually dropped to unched going into the last hour before the retrace it saw played out.
The late bounce was not surprising as it came from Phil D Gap.
Breakage below Monday’s low opens the down door while breakage below the circled 3 Day Chart low, Thursday’s low of 6569 should see accelerated momentum.
Notably 6569 also ties to the 20 DMA which, brief undercuts notwithstanding, has acted as support since April 23.