In the Beatles early days in Hamburg, Germany when they all shared a room, the other Beatles would has Lennon, “Where are we going Johnny?” To which he’d reply “To the toppermost of the poppermost!”
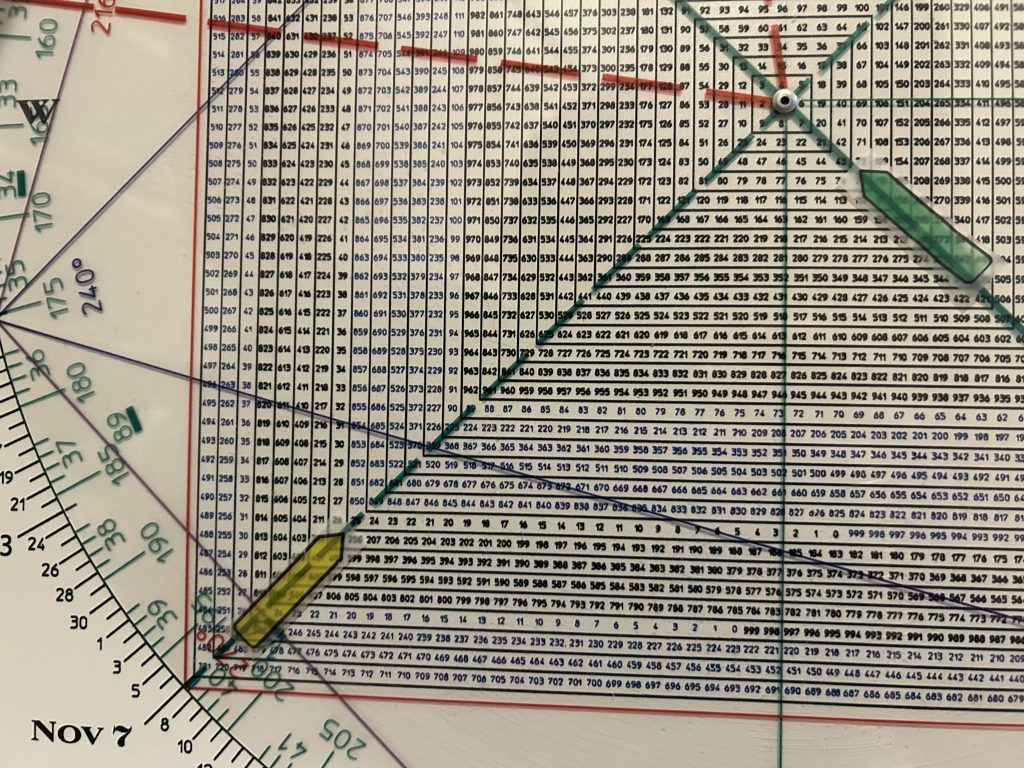
The Law of Vibration as expressed through the Square of 9 Wheel indicates it won’t be long until a top of tops is in.
The Square of 9 Wheel was around thousands of years ago being used in Egypt and India.
Obviously they weren’t using it for trading.
They were using it astrologically.
This is why it occurred to me to use the number grid not just as prices but years.
Anchoring zero to 1636 Tulip Mania squares Nov 15
Anchoring zero to 1720 squares Nov 11
Anchoring zero to 1792 birth of NYSE squares Sept 7 and Dec 7
(the 1929 top was September 3).
Anchoring zero on 1869 (9/24 Black Friday) squares Sept 28 and Dec 26
So the week of the crash in 1869 was a yearly square-out.
Anchoring zero on 1893 (banks mortgage co fail) squares Nov 7. Nov 7 is direct the year 2025.
Anchoring zero on 1913 (the Fed is created) squares September 28 and Dec 26 (see above the synchronicity with Black Friday 1869.
Anchoring zero to 1896 (Panic of 1896) squares September 3 (top in 1929)
Anchoring zero to 1907 (Panic) squares October 13 (week of top in 2007 and low in 2002)
Anchoring zero to 1921 ( August depression low before Roaring Twenties Bull) squares September 8 and Dec 7
Anchoring zero to 1929 squares November 19 (week of low in 2008 Great Financial Crisis)
Anchoring zero to 1932 squares November 15
From the 1932 post 1929 crash low to 2025 is 93 years.
On the Wheel 93 is direct/points to October 24, when all hell broke loose in 1929.
Anchoring zero on 1974 Bear market low squares November 18
Anchoring zero to 1982 squares November 9.
That’s when this secular bull began, 43 years ago.
43 squares the year 2025. THAT I think is a big deal.
Anchoring zero to 1987 squares Oct 29…the Big Kahuna in 1929.
See how those two crash years are related.
There are many more ways they are harmonics in time and price.
For example the DJIA 386 price high in 1929 squares October 19, Black Monday in 1987
Anchoring zero to 2001 squares November 29
Anchoring zero to 2008 squares Sept 10 and Dec 9th (same line vectors 667)
Anchoring zero to 2020 squares November 14
April 8th (the 2025 low +1) squares 349 the price low at the October 2022 crash
May 17th start of NYSE is opposite November 18 which ties to crash low in 1929 and the Lehman Crash low in 2008
Below is a yearly DJIA from the start of the last century.
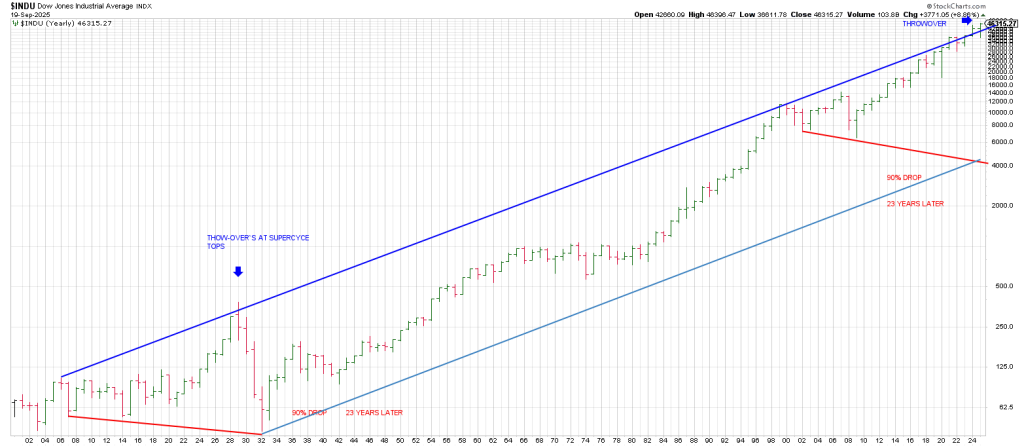
I drew a line from the 1906 top (before the Panic of 1907) to the 2000 top.
Notice the Overthrow in 1929. Remember this is a yearly bar chart.
Notice the Overthrow here in 2025.
You would expect nothing less than an Overthrow in super Cycle tops.
I paralleled the Tops Line with a Bottoms Line off the 1932 low…after the 90% drop.
It comes in at the 4000 level this year and 5000 next year. A 90% drop.
Notice that 23 years after 1906-1907 crash is the 1929 crash.
23 years after the 2002 crash low is 2025.
The presumption is a high and a crash that could start at anytime.
But November looms large.
The fuse is visible.