“Most investors learn their lessons the hard way.” Howard Marks
“I can see your face but I know that it’s not real
Just an illusion caused by how I used to feel.” Old Love, Eric Clapton
Two of the most memorable U.S stock market crashes occurred in October.
On October 28,1929 the kickoff to the Great Depression—and October 19,1987—when the SPX fell 21% in a single day and led to today’s circuit-breaks and the PPT, the Plunge Protection Team or the President’s Working Group.
Two things:
First, while most everything you read points to Oct 29, 1929 as the largest crash day of those 3 crash days in October 1929 (10/24, 10/28, 10/29), the October 28 waterfall was larger than Oct 29.
Second, the Principle of Alternation is displayed between these Big Kahuna’s.
1929 was kickoff to the Great Depression.
The second, 1987, proved not to be an economic event.
Both events created ‘Waves’ that lasted roughly 3 years.
The October 1929 shockwave perpetuated a low 2 years 10 months later in July 1932.
The October 1987 shockwave lead to a low and in October 1990 exactly 3 years later.
Markets play out in threes.
The 1987 crash and low 3 years later distinguishes itself by making a higher low in 1990.
As well of course there was an uptrend that tested/Picnocchioed the 1987 high in July 1990.
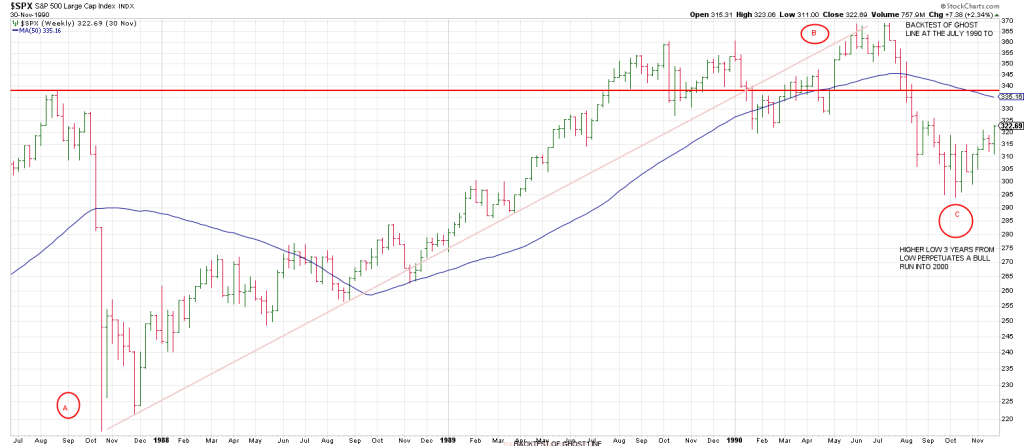
I label the count into the new high in July 1990 as a B wave and the subsequent crash into October 1990 as a C Wave. It was a dwarf C wave as C waves go.
The C wave from April 1930 to July 1932 was a escalator to hell.
I suspect the vast majority of traders kept looking for a capitulation to the October 1929 hammer
And when it didn’t come held on even as prices slid.
This is another example of the Rule of Alternation playing out: the aftermath of Black Monday in 1987 took a wildly different path than that of 1930.
If another great crash is coming, the THIRD is a series from 1929 and 1987 then we should be concerned about it echoing the 1929 shockwave in keeping with the Rule of Alternation.
Let’s take a look at the TIME relationship between 1929 and 1987.
We know that the patterns of both crashes mirror each other perfectly—
The 49 to 55 Gann Panic Zone is identical in both—the crashes were on Day 55/56 from the high.
The Panic started 49 calendar days from the high—7 squared days, 7 being the number of time and panic.
It is 58 years from 1929 to 1987.
Remarkably this is 696 months.
Recently we have been pointing to the synergy in markets with price and time to Nicola Tesla’s 3 6 9 “secret to the universe” in the markets.
We’re not going to run thru that again right now.
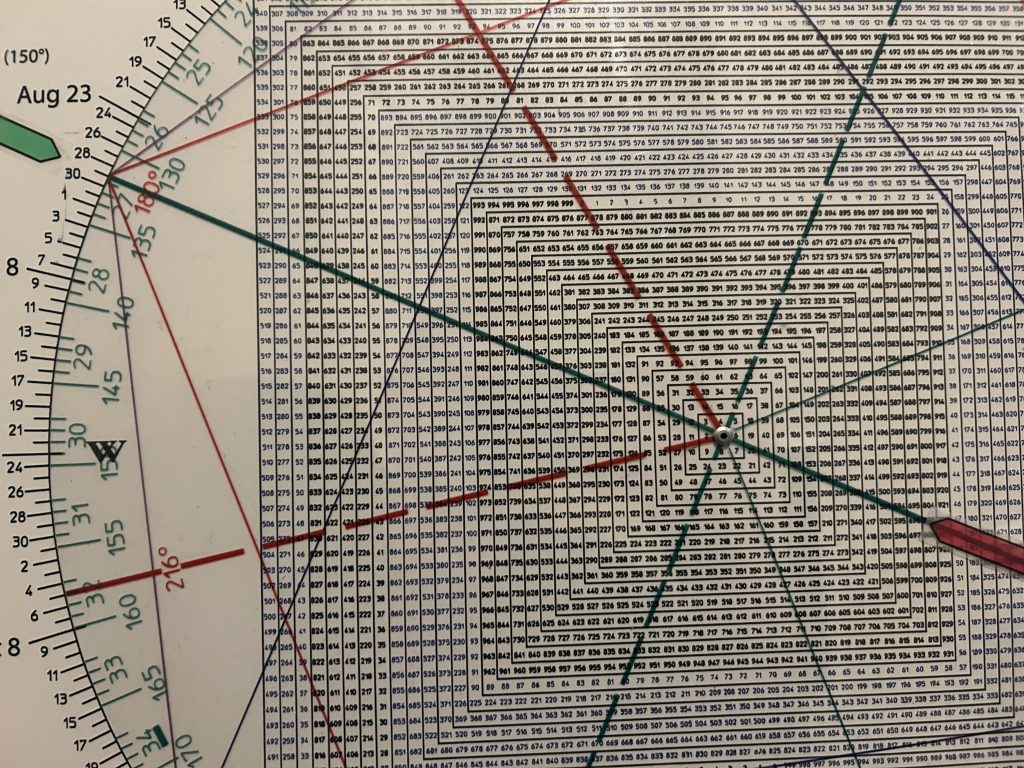
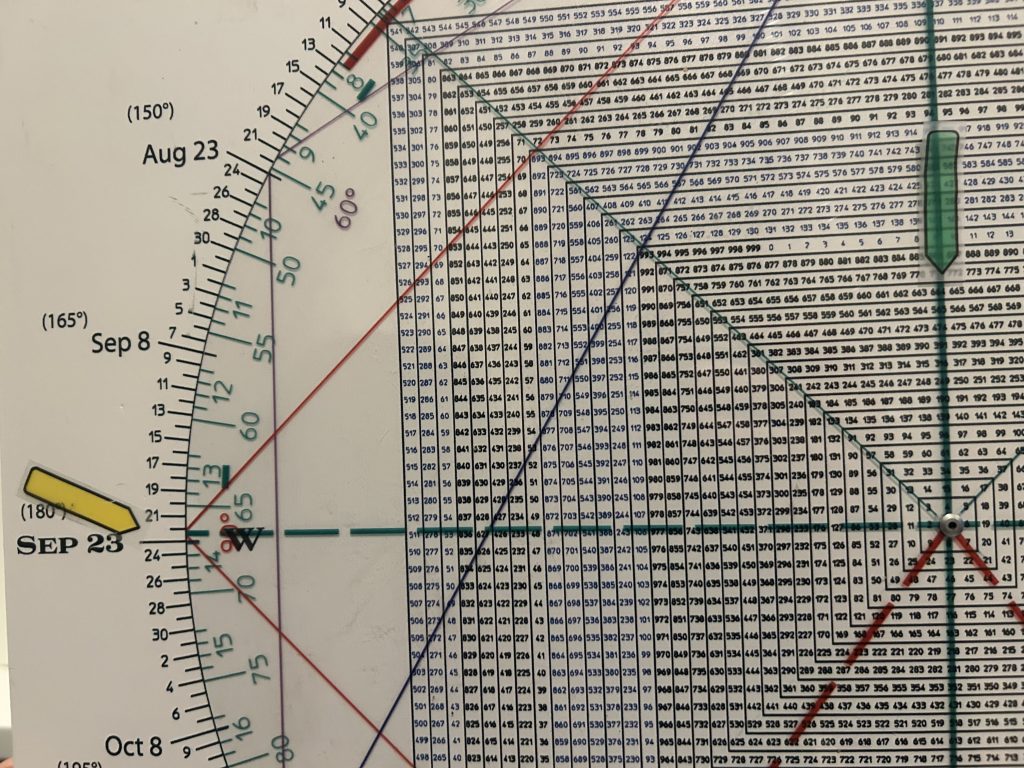
On the Square of 9 Wheel 696 is opposition August 29, right between the dates of the highs in 1929 and 1987.
Amazing.
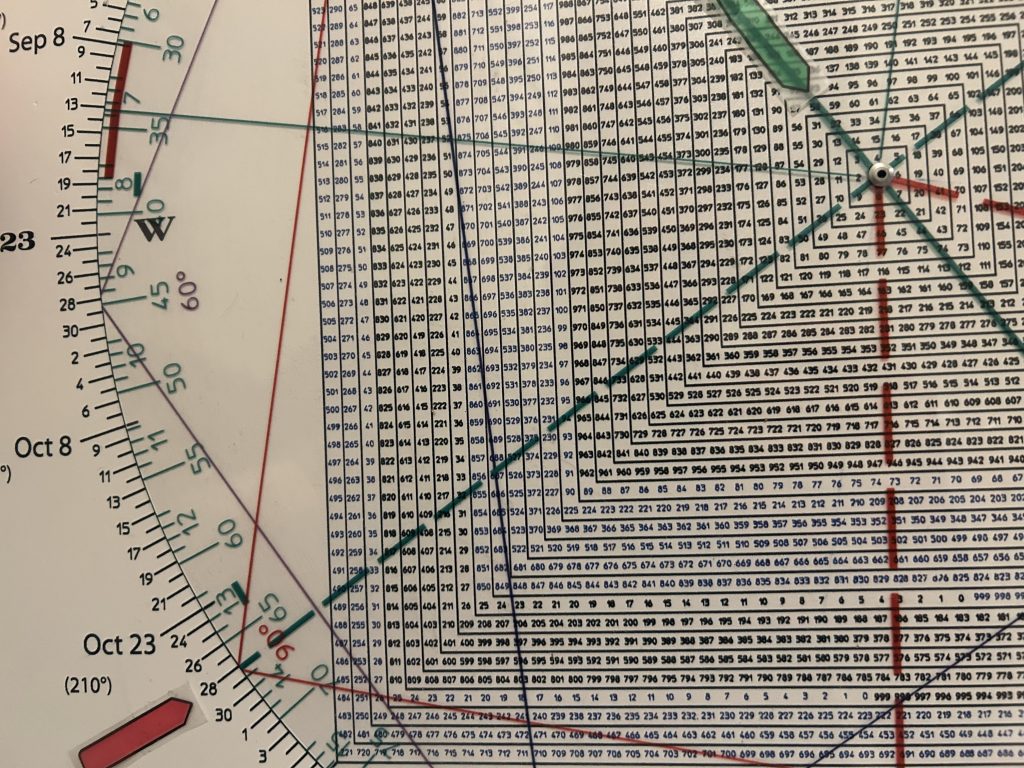
On the Square of 9 Wheel the number 58 squares out with October 28.
58 years pointed to the date of the crash in 1929.
So if you had a Wheel in the summer of 1987 it would have put you on red alert of this synergy and the expectation of a possible crash in October.
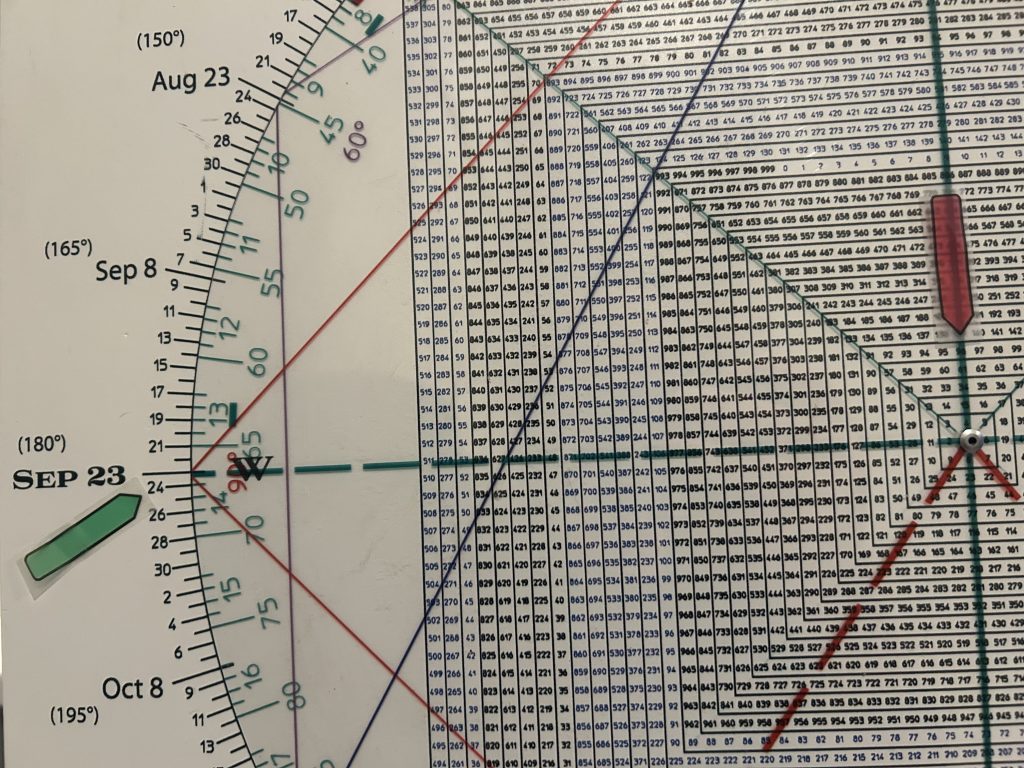
We are 96 years from 1929.
96 squares September 22, today.
We also have a Solar Eclipse and the Autumnal Equinox.
96 divided by 58 is 1.65 which ties to the Fibonacci 1.618.
Will this “third on a match” pack a punch.
I don’t think we will crash today.
Markets tend NOT to crash directly off highs.
However this synergy and square-out could be telegraphing a high.
As well remember that remarkably 664 (SPY) also squares September 22/23.
That means that 664 is direct to 96 as in 96 years ago.
There’s a lot of stuff going on here.
The SPX closed at 6664 mirroring the Bear Market low of 666 on 3/6/09.
IF this week should produce a top.
And, we start to roll over, then the time period to look for a crash is 7 to 8 weeks later—just before Christmas.
Will there be another Christmas Crash like 2018?
This December is 7 years from 2018.
Will we get Panic?
We have a roadmap.
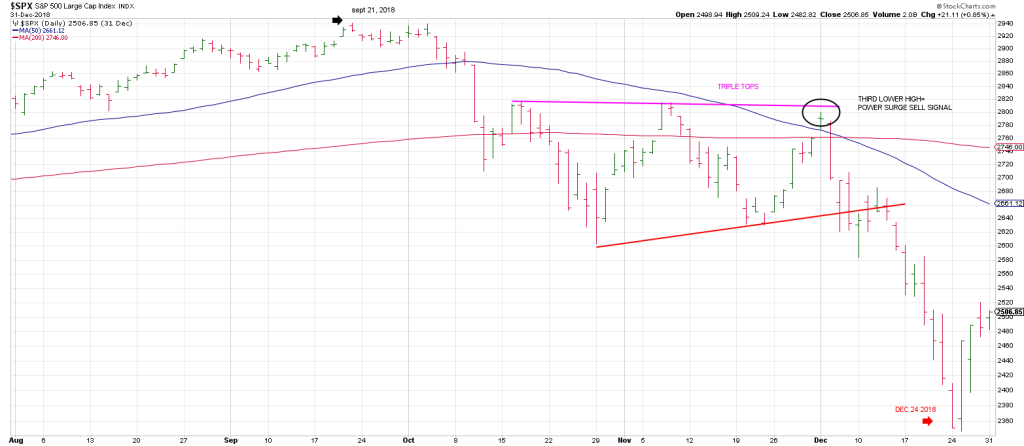
There as a high on September 21, 2018 followed by a sharp drop into October 29, the anniversary of the 1929 crashes.
You can’t make this stuff up.
From there the market consolidated but was unable to really reclaim its 200 DMA.
From a high on December 3, the SPX crashed from 2800 to 2351 on December 24,
It made a nominal new low on December 26 before leaving a large range Key Reversal Day to the topside.
In sum knowing WHEN a market could make a significant move up or down is critical for swing traders and short term traders.
It is also one of the most difficult aspects of market analysis.
It is what the combination of the 3 Week and 3 Day Chart method in conjunction with the Square of 9 and The Cycle and The Pattern does best.
As Daniel Kahneman writes, “Pattern recognition is the ability to find the signal in the noise.”
These are how the markets talk to us.
However, the T Rex in the ointment, The Hook, is that Mr. Market will do his best to get us to ignore the signs he leaves— often when it is most important to listen.
He will do this by shrugging off several air pockets and shakeouts on the way to the ultimate top.
He will look impervious, luring the smart money that was reluctant after the spring Tariff Tantrum, back into the fray.
They have to be back in, because that is what they are paid to do.
Performance pressure eclipses risk.
They have been running back in in droves.
It is important to remember that Mr. Market’s job number one is to deceive.
He good.
GOLD