“The money lost by speculation alone is small compared with the gigantic sums lost by so-called investors who have let their investments ride.” Jesse Livermore
The following charts depict Hit and Run Setups for this past week.
They all share two conceptually correct concepts: whether coiled to “come-out” or in the midst of a Runaway Move, stocks breathe—they inhale and exhale, they contract and expand within the structure of their trend as well within the size of their daily and weekly ranges.
As well, typically, stocks walk before they jog, jog before they run and run before they sprint.
In sum, the same patterns I wrote about in the Hit and Run books in the late 1990’s are working today because human nature doesn’t change and because the market isn’t a random walk.
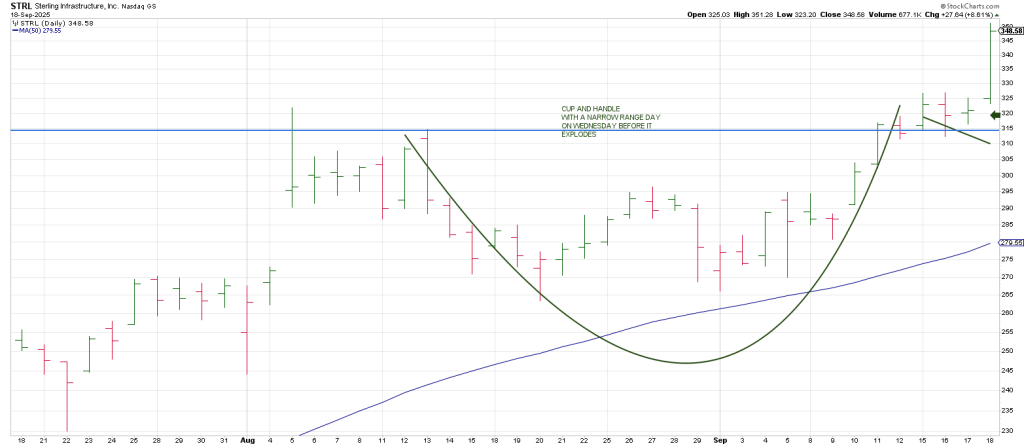
STRL exploded out of a Narrow Range Day on Wednesday within the context of a Cup and Handle.
The Cup and Handle was above the 50 DMA.
We often play the same stocks because stocks have their own personality and once you get to know them, you have a better idea of what to expect—like an old friend.
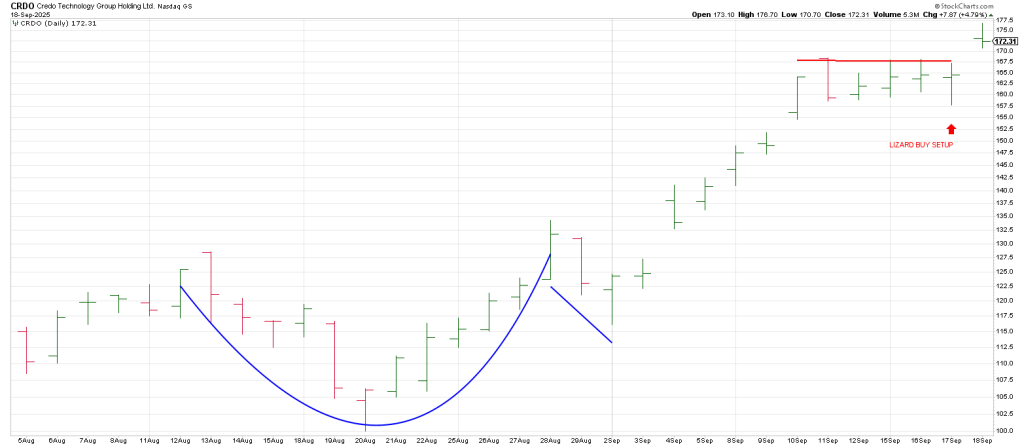
CRDO came out of a Cup and Handle in early September, then exploded again yesterday on the heels of a Lizard buy setup (a 10 10 Bottoming Tail).
Gapping above the Sept 11 signal Reversal bar lit the fuse on Thursday, triggering a Reversal of a Reversal or what I call a Keyser Soze, from the movie The Usual Suspects.
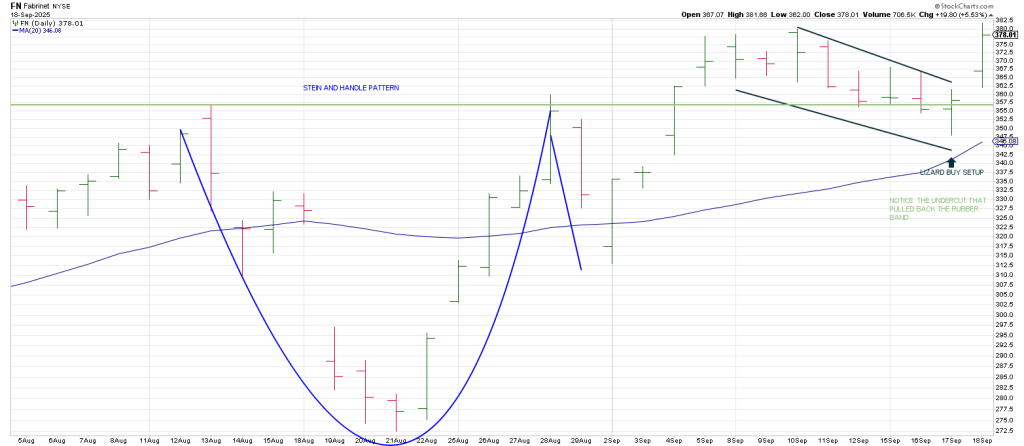
FN came out of a Stein and Handle pattern (a cousin to the Cup and Handle) in early September.
Then it pulled back/consolidated carving out a Bull Flag leaving a Lizard buy setup on Wednesday.
Undercutting the light green horizontal line served to pull the rubber band back.
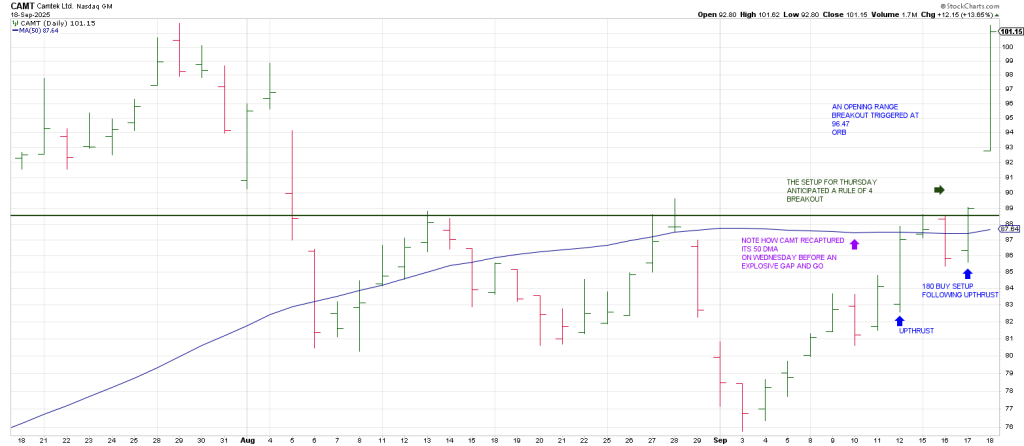
CAMT was telegraphing a Rule of 4 Breakot on Wednesday before Thursday’s explosive Gap & Go.
Notice the momentum last Friday defined by a large range, the largest range in 7 days.
It pulled back from its 50 DMA on Tuesday then produced a stealth close above its 50 DMA and a horizontal resistance on Wednesday.
The “Combo” setup allowed us to anticipate continuation.
An Opening Range Breakout (ORB) on Thursday telegraphed a trend day to the upside.
OKLO triggered an Angular Rule of 4 Breakout on Sept 11, turning its 3 Day Chart up in the process triggering an explosive continuation above its August peak.
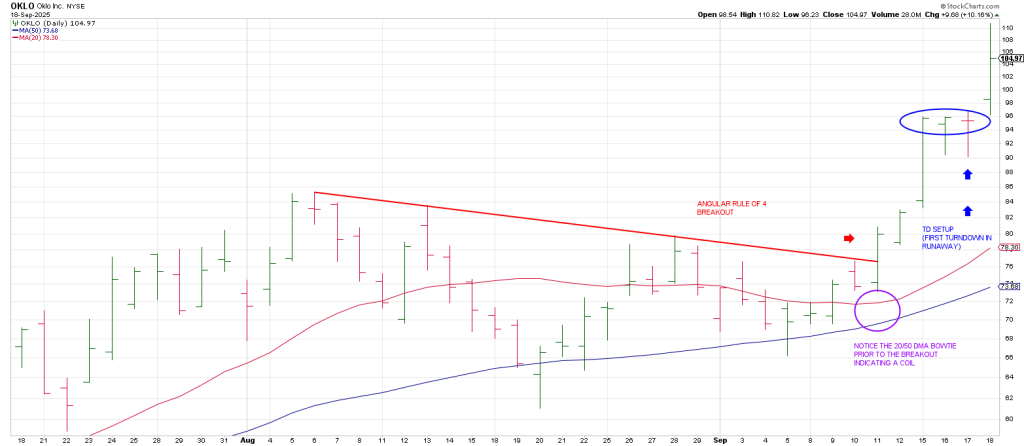
Notice that Wednesday the dailies turned down but closed near session highs.
This was the first turn down in the dailies since the breakout.
First turn downs in the dailies in the midst of accelerated momentum often signal a fesh impulse higher.
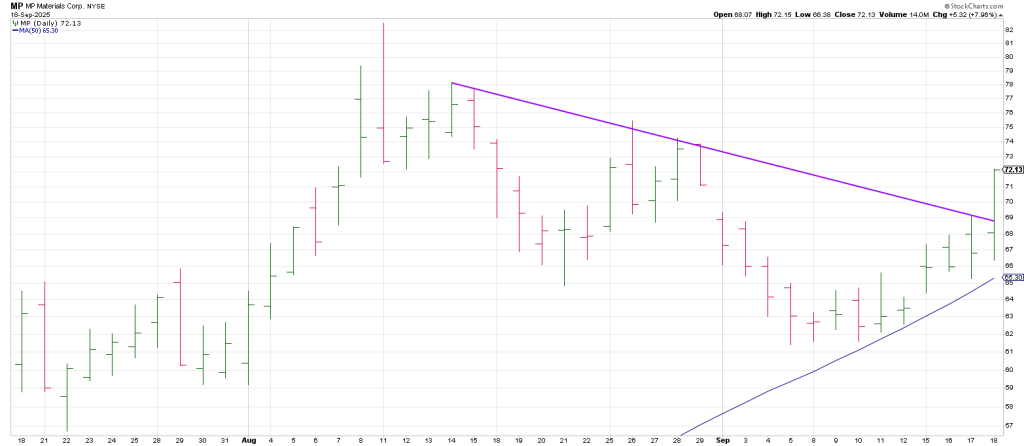
Hit and Run took MP long on an alert on the Hit and Run Private Twitter Feed on Thursday as it was triggering an Angular Rule of 4 Breakout around 68.50.
Notice the base at the 50 DMA.
AMD was a short setup late Wednesday.
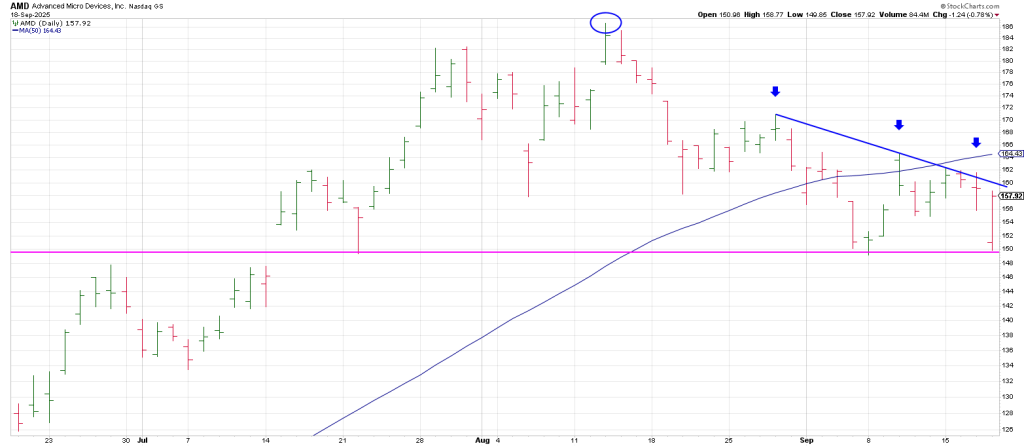
AMD was forming a 3rd lower high or what I call a Power Surge setup.
3rd lower highs often lead to fast declines (and vice versa).
AMD gapped down 8 points before tailing up leaving triple bottoms at the 150 region.
Breakage below the triple bottoms will open the down door.
Let’s take a big picture look at the lead dog, SMH.
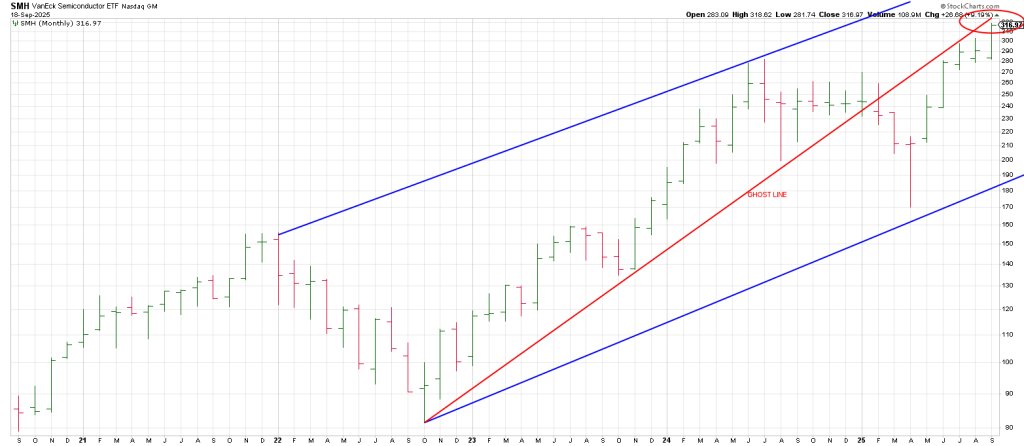
The blue trend channel opens the door to the possibility of higher prices if SMH can clear and then follow thru above the red Ghost Line.
I call these Ghost Lines because they are broken trend lines that come into focus in the future.
In this case SMH has been walking up the bottom of this Ghost Line.
Notice that the 3 Month Chart turned down in April and reversed leaving a large monthly Bottoming Tail. This signature, this one monthly bar, forecast this 6 month rally.
The price action once the monthlies turn down will give us a lot of information.
Below is an hourly SPX from Wednesday’s Fed Day.
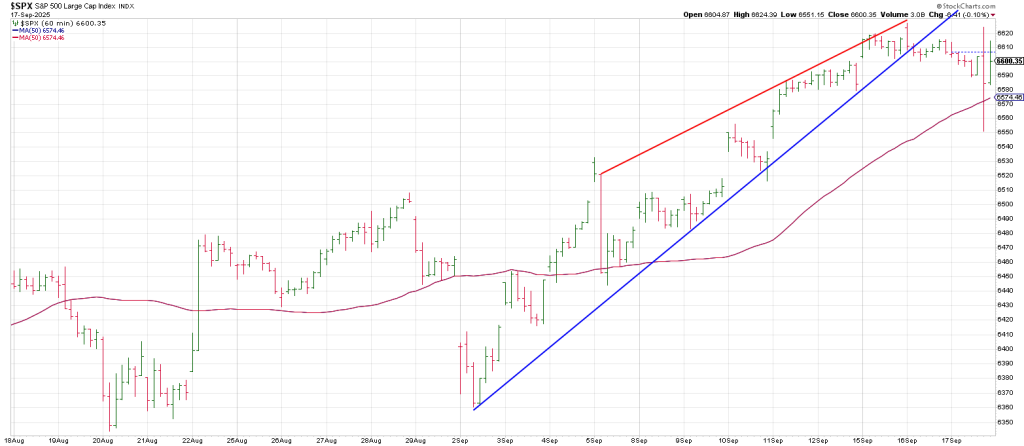
It shows the typical FOMC Cha Cha pattern.
Importantly the short term trend was broken in mid-September as the index dropped out of an hourly Ending Diagonal.
Yesterday, the SPX spiked to test the blue Ghost Line.
The price action into a cluster of cycles and square-outs due to exert their influence early next week will tell the tale of the tape.