“When it comes to being lucky, she’s cursed” The First Cut Is the Deepest, Rod Stewart
“If something is supposed to happen and doesn’t happen, that should make your antenna go up as soon as possible…If something is supposed to be and it isn’t, then the reverse will occur.” Victor Sperandeo
Historically, bull market peaks have often occurred after the Fed has shifted from hiking to cutting, since cuts usually come in response to economic stress or financial tightening that eventually undermines the market.
But there are a few notable cases where the final high of a bull cycle came very close in time to a first rate cut.
1) 2000 Dot-Com Peak: SPX March 24,2000 and NAZ March 10,2000
First rate cut: Jan 3 2001, 9 months later. Fed was still on hold after tightening in 1999-2000
2) 2007 GFC Peak Oct 9, 2007 SPX all-time high
First rate cut Sept 18, 2007 just three weeks apart. The market pushed to its final highs immediately after the first rate cut.
3) 1987 Peak, August 25, 1987
Fed raised rates earlier that year then cut aggressively after the October crash. So the final peak preceded cuts by two months
4) 2020 Pre-Covid Peak Feb 19, 2020, SPX
First emergency Cut March 3, 2020. Very close, but not the same week.
5) 1973-74 Bear Market
Bull Peak, Jan 11, 1973. First rate cut August 1974, The Fed stayed tight through the top.
The pattern itself is telling: when the Fed first cuts, the bull is usually already on borrowed time, and the peak often comes immediately before or after.
Also notice the Pre-Covid Peak was February 19th, the same as the pre-crash peak in 2025.
In 1929 the Fed cut beginning Nov 1st after the crash.
After the March 6, 1937 high easing came later in 1937-38 after recession deepened.
There are no confirmed bull market peaks that coincide exactly the same calendar week with a Fed rate cut.
Many peaks occur after or just before the Fed begins easing, but the typical pattern is either the peak happens just before the cut (as in 2020 or 2007) or the cut occurs, and only shortly thereafter does the market top out.
The closing in timing seem to be 2007 (cut is 3 weeks before the peak) and 2020 (cut 2 weeks after)
A same-week match of a market top and Fed rate cut is rare because the Fed typically cuts in response to a deterioration in economic data or financial conditions and markets generally anticipate or immediately or immediately react—but market tops can occur before, during or after the Fed’s first easing action.
The Pattern: peaks clustered closely before or after the Fed begins cutting but not in exact same week synchronicity.
There is a special synergy with 2025:
1) 25 years is 1/2 the Biblical Jubilee Cycle. 25 years ago was the 2000 peak.
25 years before that was the Dec 1974 bear market bottom.
50 years prior to the major 1982 bottom was the major 1932 low.
Bretton Woods was July 22, 1944.
The Nixon Gold Shock was August 13, 1971
27 years
1971 +27 years = 1998
In 1998 there was the LTCM Crisis.
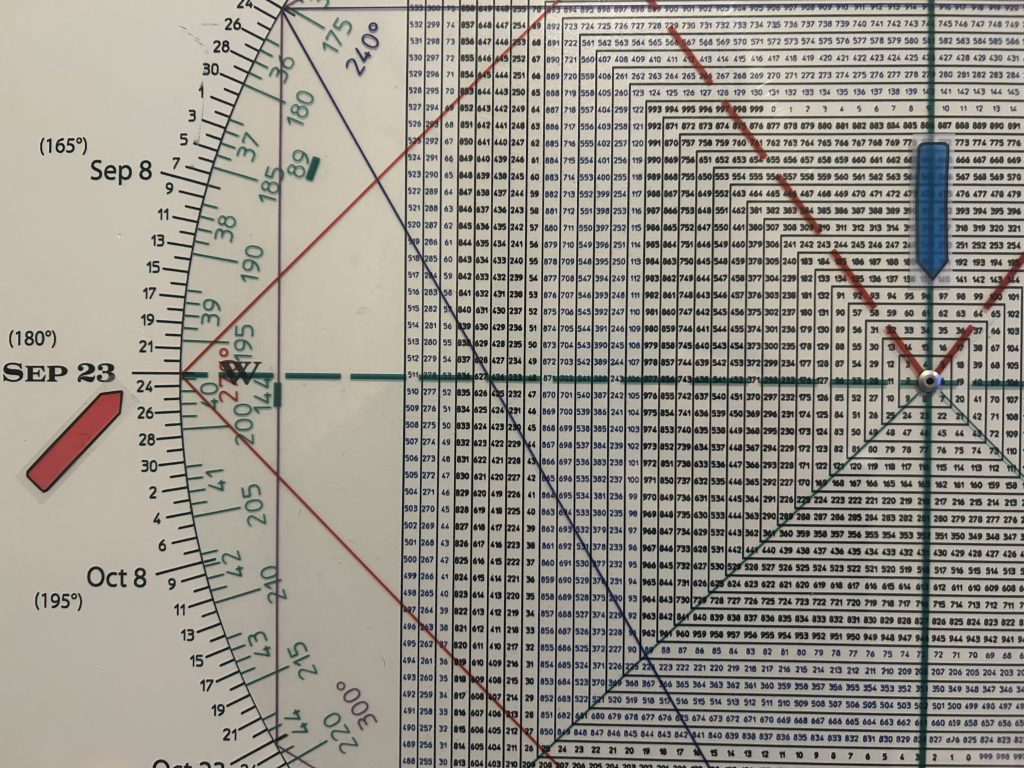
ON SEPTEMBER 23, 1998 Long Term Capital Management was bailed out.
27 years after 1998 is 2025
This September is particularly interesting as we have a solar eclipse on Sept 21st. coinciding with the Autumnal Equinox on September 22.
On the 27th anniversary of the LTCM crisis.
On the Square of 9 Wheel, the number 27 is opposite April 7th and direct to October 9-11.
We flagged yesterday the anniversaries of the Oct 9-11 top in 2007 and the bear low in 2002.
On September 22, 1987 the DJIA left a double bottom and a large-range outside up reversal day.
When that reversal day was violated on October 12, 1987 it triggered a Keyser Soze reversal of a reversal sell signal and the crash started.
Slowly at first, then all at once SEVEN days later.
Anniversary dates are important to Gann Methodology.
Let’s see what happens on September 21-22, 2025.
Jamie Dimon is looking for a bond panic.
September-November 1929, was 96 years ago.
On the Square of 9 Wheel, 96 squares September 23.
In 1929 there was a solar eclipse on November 1st, two days after the Big Kahuna.
There was a lunar eclipse on November 16, 1929, 3 days after the crash low.
Yesterday the SPX closed at 6606 mirroring the 666 low on March 6, 2009.
The index left a stealth narrow range Gilligan Sell signal—a gap up to a new 60 day high with a close at/near session lows.
The September 3rd high in 1929 is a 9 3 3 (1929 boils down to 3).
2025 is a “9” year so September 21, 2025 is a 9, 3, 9.
Maybe something, maybe nothing but Gann’s Law of Vibration seems to be pointing to this September-November period in 2025.
If the market makes a top in this September period there is a strong likelihood of a crash in November, 7 Gann weeks later.
Alternately, if the market explodes from here (potentially after a shake-out), the likelihood is November is a major top.